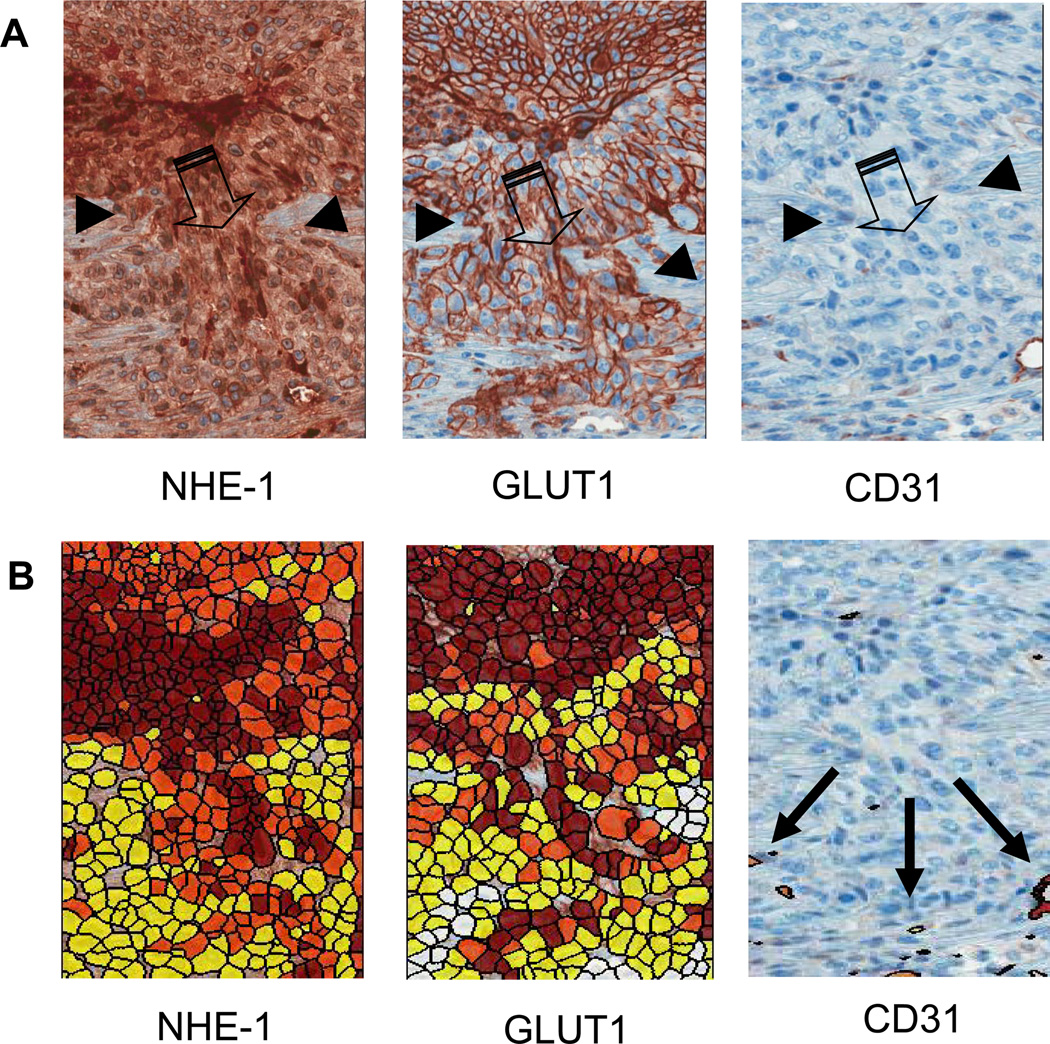
Figure 4. Histology of the invasive edge.
(A) Upregulation of NHE-1 exchangers and GLUT-1 are demonstrated by a darker staining of the tumor cells at the invasive front, consistent with an increase in glycolysis and acidosis. CD31 staining is low, suggesting poor perfusion and hence a potential for hypoxia. Images illustrate a region of the tumor edge (small thin arrows) invading into the peritumoral normal tissue (large arrows). (B) Expression of tumor markers GLUT-1, NHE-1, and CD31 were quantified on a per-cell basis (see Methods). Red indicates strong staining, orange is moderate and yellow is weak.

