
Figure 2.
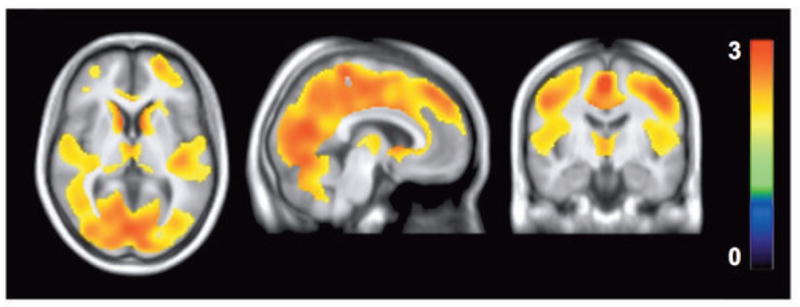
Statistical parametric mapping (SPM) analysis shows lower VT in patients with alcohol dependence (n=18) than in control subjects (n=19) at baseline as a large single cluster. This cluster comprised of 81,026 voxels and had a maximum t value of 3.2 at [0, −34, 60] and a cluster-level family-wise error (FWE) corrected p value of 0.038. Color bar represents t value in each voxel within the significant cluster.