
Fig. 1.
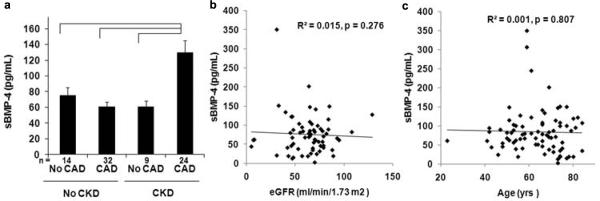
a sBMP-4 is increased uniquely in subjects with the combination of CAD and CKD. Mean sBMP-4 concentration in subjects without CAD or CKD, CAD alone, CKD alone or CAD and CKD are shown. Brackets indicate p < 0.05. b sBMP-4 does not correlate with eGFR. An X–Y scatter plot of sBMP-4 versus eGFR is shown. Line indicates linear regression fit to the data (R2 = 0.015, p = 0.276). c sBMP-4 does not correlate with age. An X–Y scatter plot of sBMP-4 versus age is shown. Line indicates linear regression fit to the data (R2 = 0.001, p = 0.807)