
Figure 1. Repression of pro-inflammatory expression by NOE and SPE in RAW 264.7 macrophages.
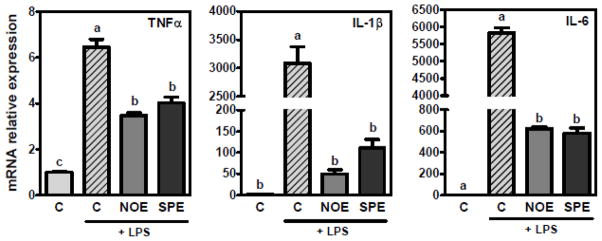
Cells were pre-treated with 100 μg/mL of NOE or SPE for 12 h followed by co-incubation of 100 ng/mL LPS and algal extracts for additional 18 h. qRT-PCR analysis was conducted to measure mRNA levels of TNFα, IL-1β and IL-6. Values are expressed as mean ± SEM, P < 0.05, n = 15–18.