
Figure1.
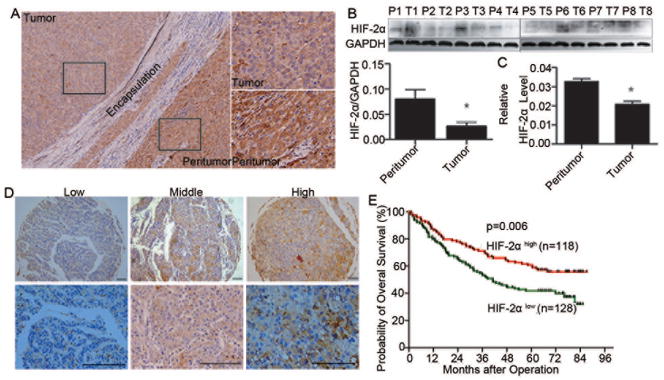
The expression level of HIF-2α in HCC patients and its clinical significance. (A) Representative images of HIF-2α staining in HCC tissue and corresponding peritumoral tissues. (B) The expression levels of HIF-2α in tumor and corresponding peritumoral tissues. Quantitative analysis of protein levels were determined by measuring the ratio of HIF-2α to GAPDH expression. Error bars indicate the standard deviation (SD).*, p=0.02 by two-tailed test. (C) Quantitative RT-PCR analysis of HIF-2α levels in HCC tissues and corresponding peritumoral tissue. GAPDH was used as a control. Error bars indicate standard deviation (SD) (n=60). *, p<0.001 (two-tailed test). (D) Expression of HIF-2α was examined via immunohistochemistry in 246 hepatocellular carcinoma specimens, and representative images are shown. Scale bar, 10 mm. (E) Kaplan-Meier analysis of overall survival (OS) in 246 HCC patients relative to HIF-2α expression.