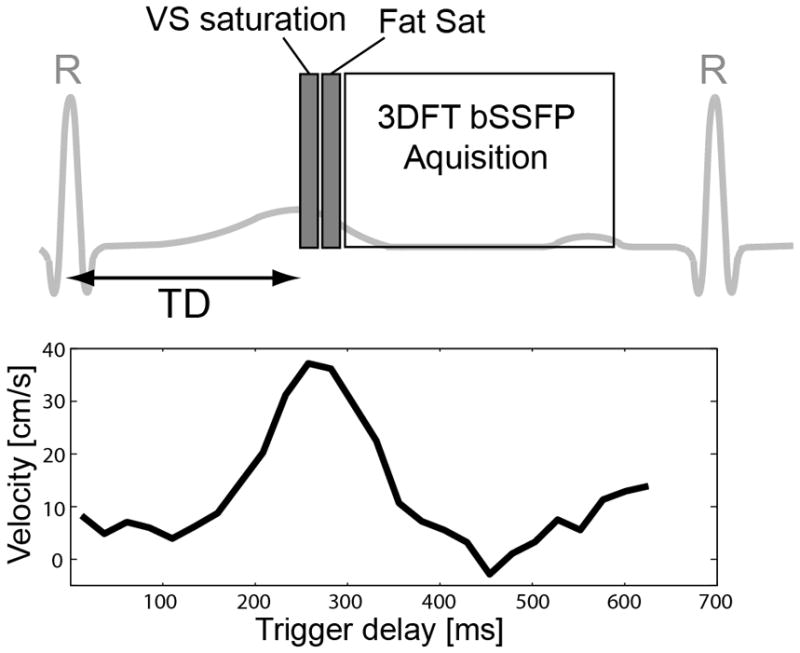
Figure 5.

Timing diagram of the VS saturation-prepared peripheral MRA sequence (top). The sequence was cardiac triggered by peripheral gating, and consisted of a VS saturation pulse, a spectrally selective fat saturation pulse, and a segmented balanced SSFP 3DFT readout with centric and linear orders along phase- and partition-encoding directions, respectively. The VS saturation pulse was played at the time of peak systolic flow by adjusting a trigger delay (TD) based on prior phase-contrast flow MRI. A representative velocity measurement in the anterior tibial artery is shown at the bottom.
