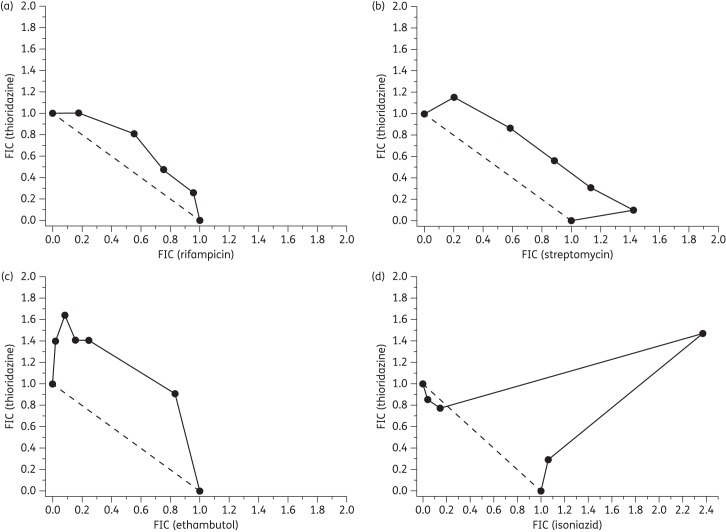
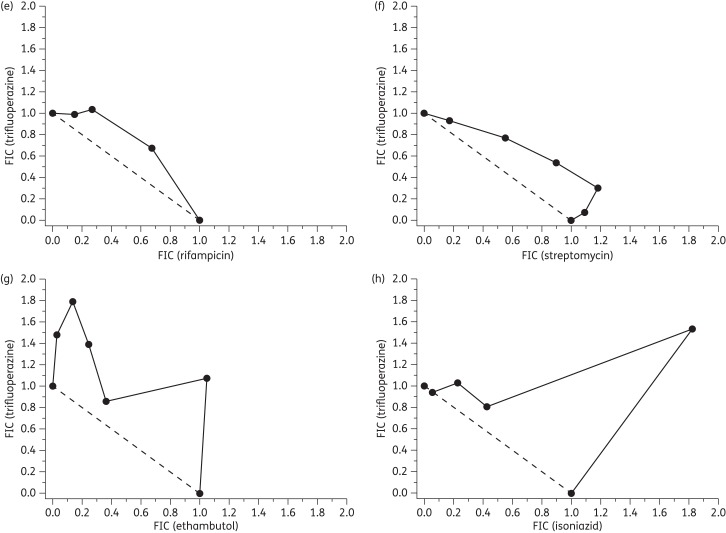
Figure 4.
Isobolograms for thioridazine in combination with (a) rifampicin, (b) streptomycin, (c) ethambutol and (d) isoniazid. Panels (e–h) show isobolograms for trifluoperazine in combination with the aforementioned antitubercular compounds, respectively. Fixed ratios of each pair of compounds were prepared and used to determine IC50 values for each compound. Subsequently, the 50% fractional inhibitory concentration (FIC) for each compound in combination was calculated (see the Materials and methods section) and plotted as an isobologram. Compounds demonstrating an additive effect have a summed FIC ≈ 1 (dashed line), whilst antagonistic and synergistic combinations have values >4 and <0.5, respectively.57


