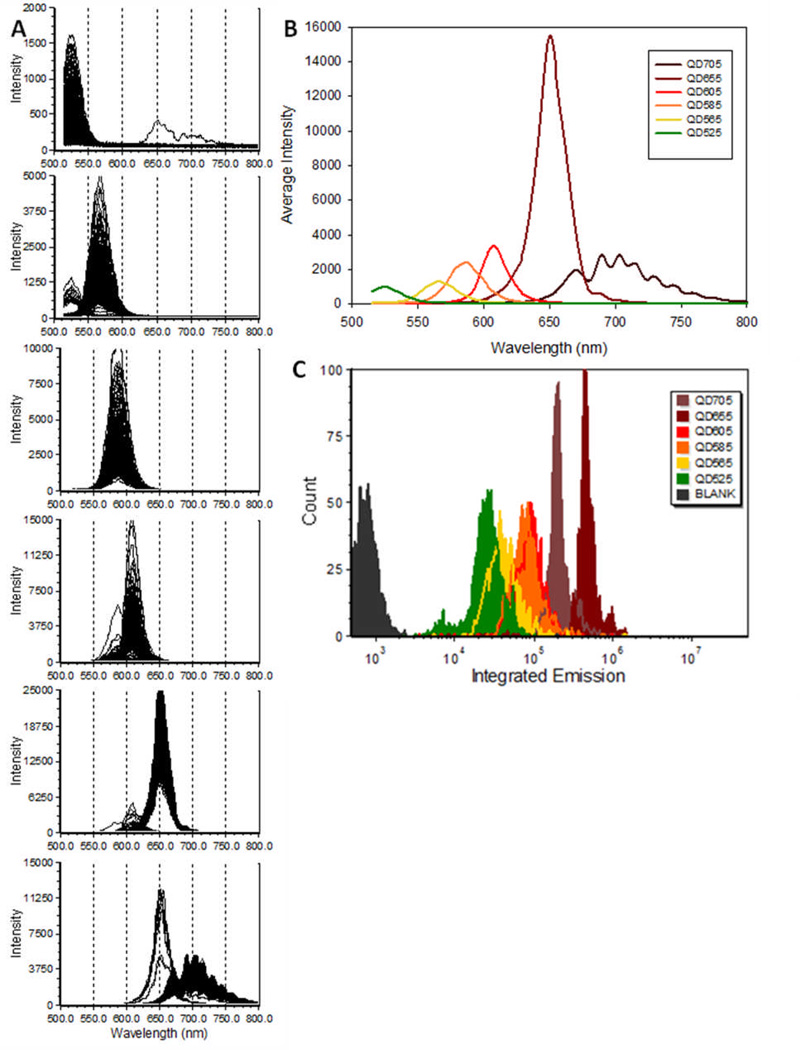
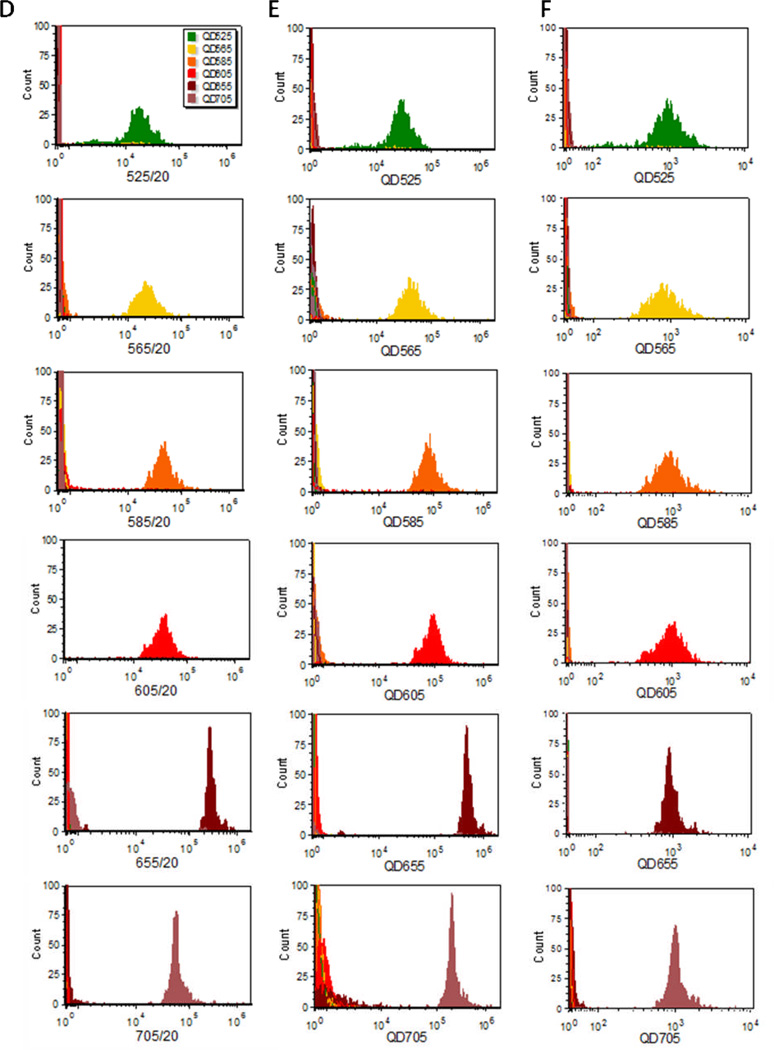
Figure 3.
Fluorescence spectra of QDot stained beads. A) Individual spectra of beads stained with QD525, QD565, QD585, QD605, QD655, and QD705 (from top to bottom). B) Average single bead spectra from the data shown in (A). C) Integrated intensity histograms from the data shown in (A). D) Intensity histograms from application of virtual bandpass filters to spectral data. E) Intensity histograms from unmixed spectral data using the reference bead spectra. F ) Abundance histograms from unmixed spectral data using the reference bead spectra and intensities.


