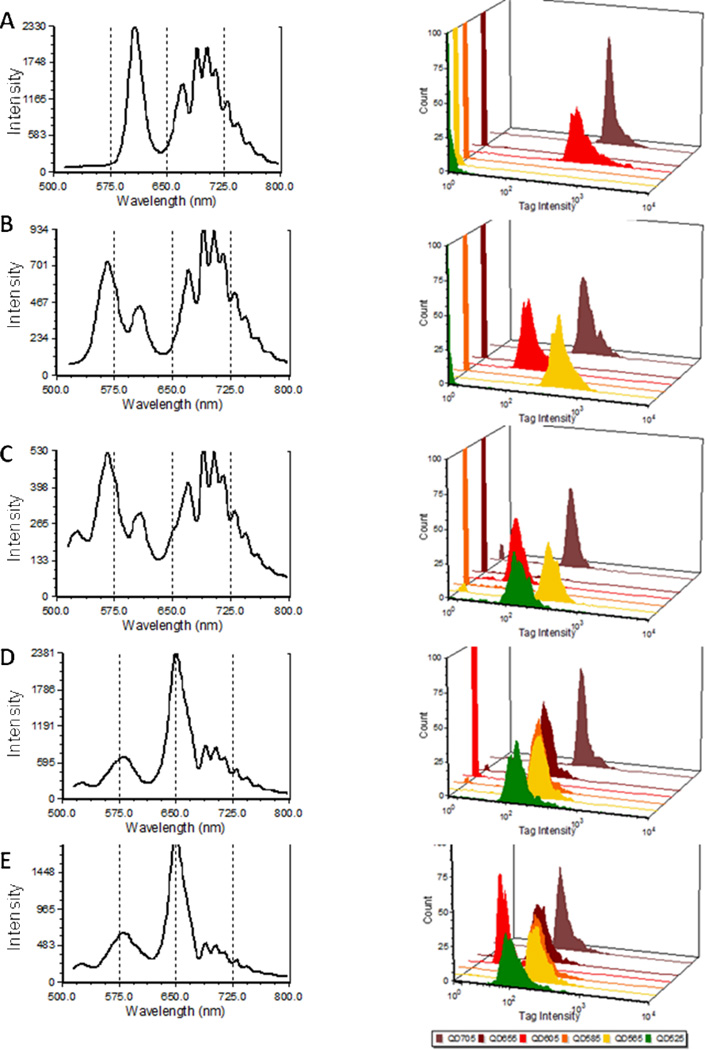
Figure 4.
Spectral encoding using Qdots. Average spectra (left) and abundance histograms after spectral unmixing (right) of beads stained with A) two (QD605+QD705), B) three (QD565+QD605+QD705),C) four (QD565+QD585+QD605+QD705), D) five (QD525+QD565+QD585+QD655+QD705), or E) all six Qdots (from top to bottom) as measured by spectral flow cytometry.

