Figure 5.
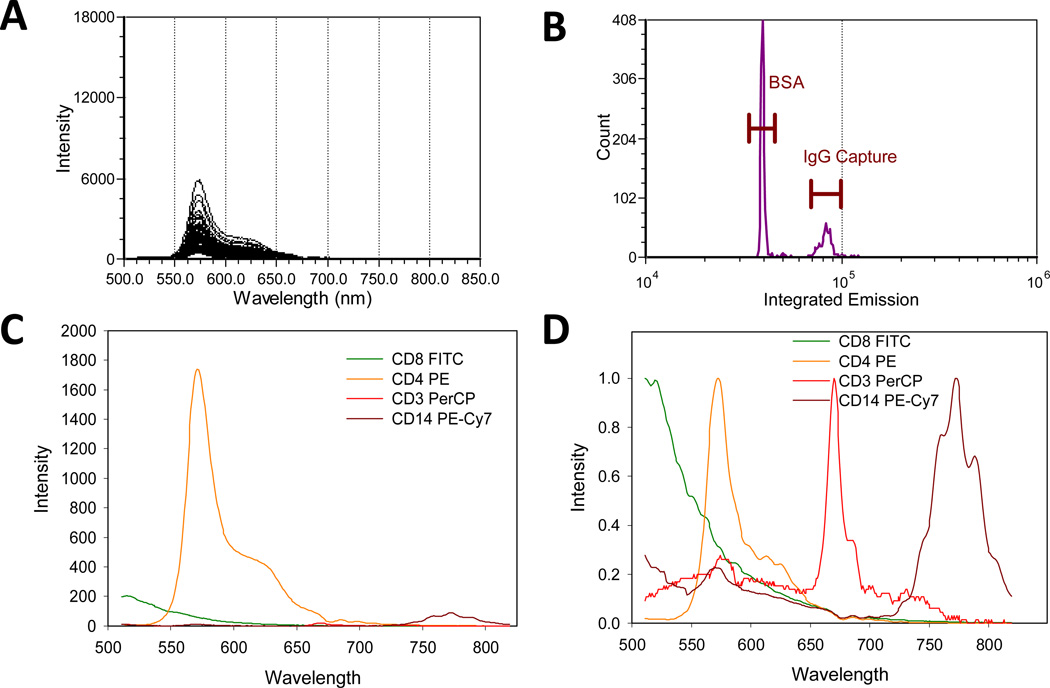
Spectral flow cytometry of labeled antibodies on capture beads. (A) Single bead spectra and (B) intensity histograms of a BSA/antibody capture bead cocktail stained with PE-antiCD4 antibody. (C) Average spectra and (D) normalized average spectra of the bright antibody capture beads stained with FITC-antiCD8, PE-antiCD4, PerCP-antiCD3, and PECy7-antiCD14.

