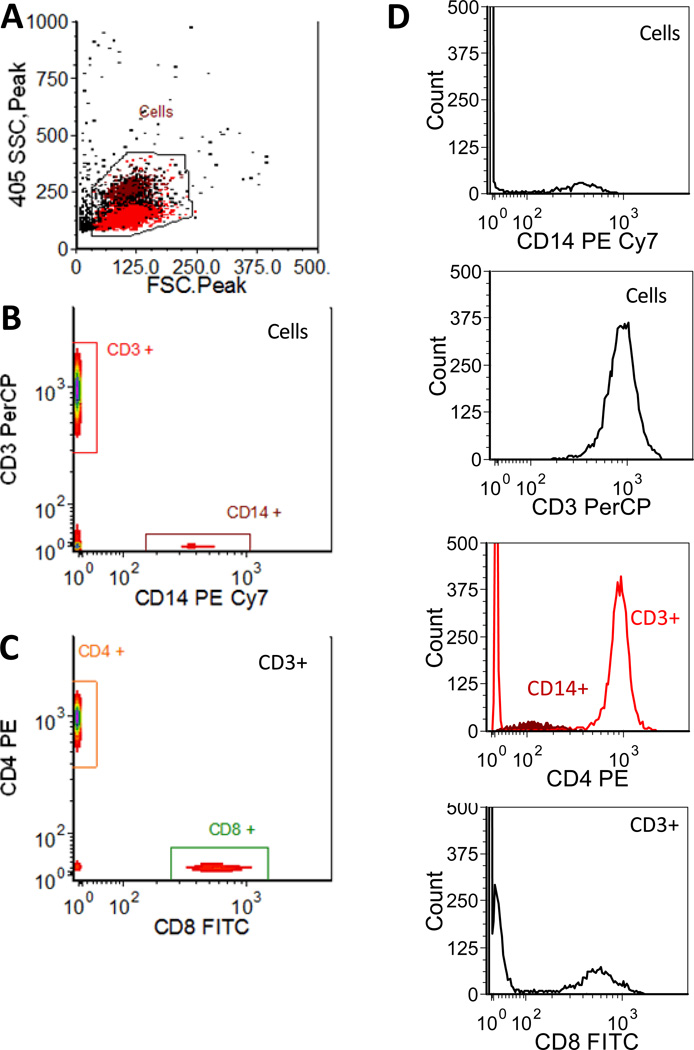
Figure 6.
Spectral flow cytometry of fluorescence-labeled PBMCs. A) Light scatter histogram showing back gating of CD3 and CD14 positive cells, B) bivariate histogram of CD3 vs CD14 staining, and C) bivariate histogram of CD4 vs CD8 for CD3 positive cells. (D) Single parameter histograms for each marker, with gates indicated.

