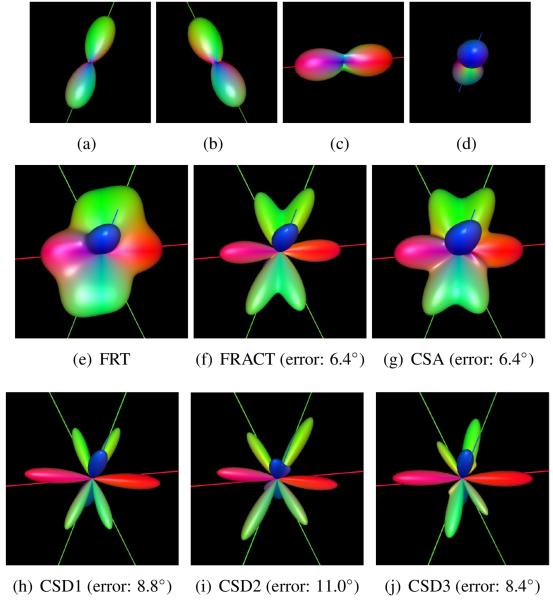
Figure 16.
Application of the FRT, the FRACT, CSA, and CSD to a mixture of fibers from in vivo human brain data. Data was combined from image voxels displaying a single dominant diffusion orientation, as shown in (a-d). FRT ODFs are shown for voxels corresponding to (a,b) forceps major, (c) genu of the corpus callosum, and (d) corticospinal tract. Reconstructions of the multi-fiber combined dataset are shown for (e) the FRT, (f) the FRACT, (g) CSA, (h) CSD1, (i) CSD2, and (j) CSD3. The lines shown in each image correspond to the dominant orientations estimated from (a-d). The figure captions show the maximum angular error between the estimated ODF maxima from the combined data and the ODF maxima from the original single-orientation data (this is not shown for the FRT, since the FRT fails to resolve all of the ODF peaks).

