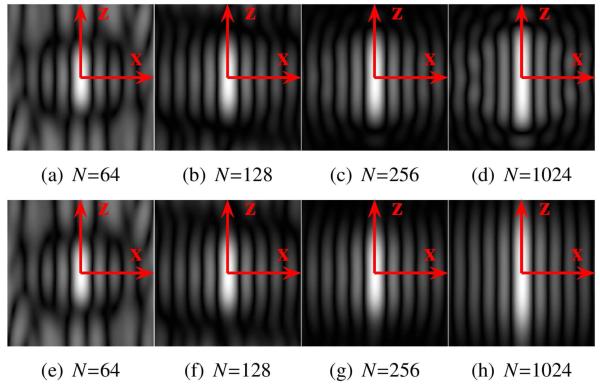
Figure 5.
Images showing the magnitude of in the x-z plane for the FRT, in the presence of finite sampling of the sphere and truncation of the spherical harmonic series. (a)-(d) Results using L = 8. (e)-(h) Results using L = 32. Results can be compared to the ideal response function shown in Fig. 1(b).

