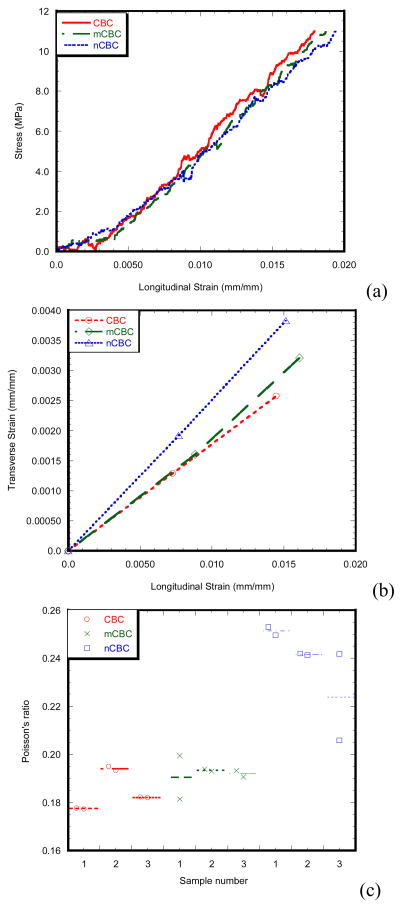
Figure 4.
(a) Longitudinal stress vs. longitudinal strain plots of a CBC, mCBC and nCBC specimen. (b) Transverse strain vs. longitudinal strain plots of a CBC, mCBC and nCBC specimen calculated at 30 sec and 60 sec test time. (c) Dot plots of the Poisson’s ratios of three CBC, mCBC and nCBC samples. Plots show the two Poisson’s ratio measurements for each sample at 30 sec and 60 sec test times.

