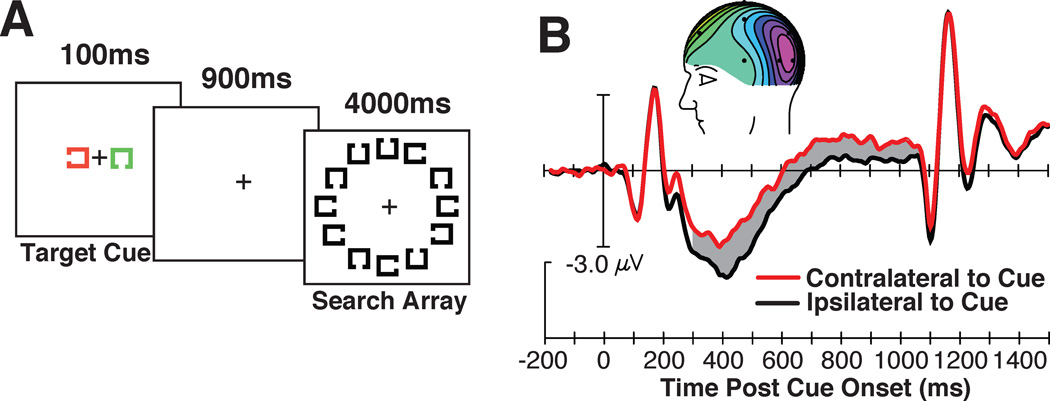
Figure 4.
The stimuli, findings, and relationship between the cue-elicited ERPs and behavior. (A) Example of the stimulus sequence and the grand-average waveforms from electrodes T5/6, contralateral (red) and ipsilateral (black) to the location of the cue on each trial. The gray region shows the epoch in which the significant CDA was measured and inset shows the voltage distribution. (B) Visual search accuracy as a function of the CDA amplitude measured following the cue. Note that a more negative voltage equals a larger CDA. Each point represents the data from an individual subject and the dashed line represents the linear regression. Adapted from Woodman & Arita (2011), with permission from the Association for Psychological Science.

