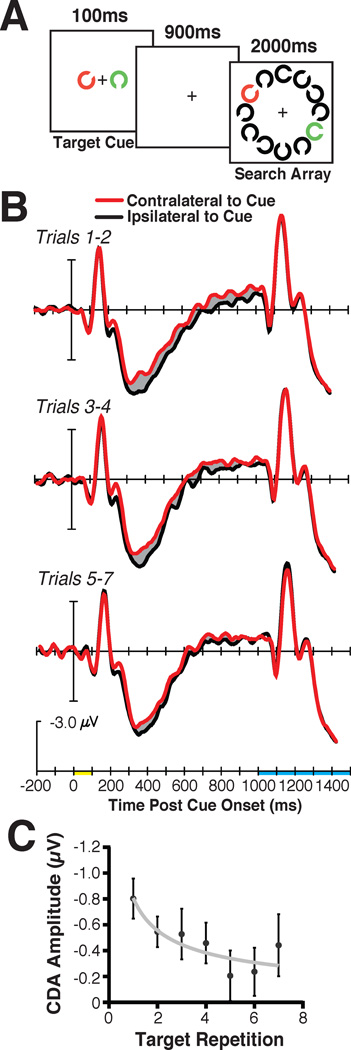
Figure 5.
The stimuli (A) and grand average ERP results (B), time locked to the cue presentation (yellow on time axis) until search array onset (shown in blue on the timeline) from consecutive groups of trials. Bottom panel (C) shows the CDA amplitude across consecutive trials with the same search target. The gray line shows the power-function fit and the error bars represent ±1 S.E.M. Reprinted from Carlisle et al. (2011), with permission from the Society for Neuroscience.

