Figure 3.

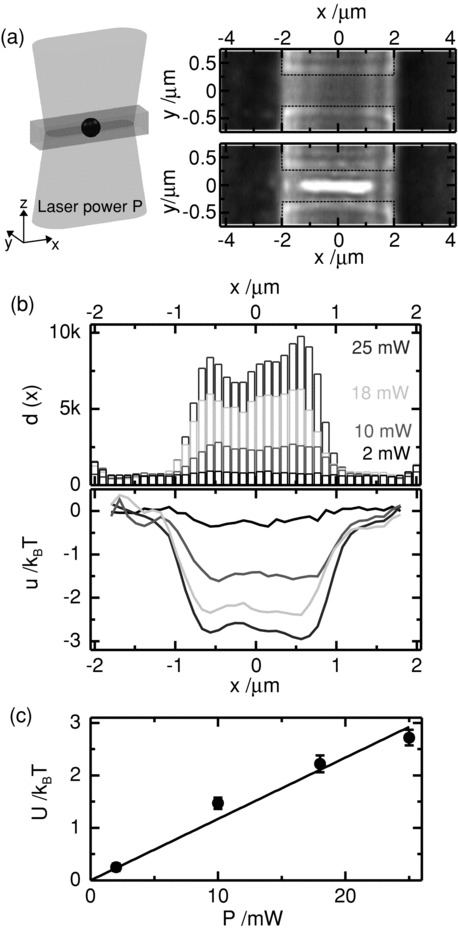
Characterization of potential in channel: (a) Scheme: a laser line trap based on holographic optical tweezers in the channel creates an attractive potential for the diffusing particles. Micrographs: light microscopy images of a channel without particles imaged with hot mirror in front of the camera (upper panel) and without (lower panel). The lower image clearly shows the extension of the IR-laser focus creating the line trap. Dashed lines indicate the channel edges. (b) Histograms of position dependent particle distribution d(x) along the channel for laser powers of P = 2, 10, 18, 25 mw and corresponding energy potential landscape u(x) as evaluated by using the Boltzmann distribution (see Experimetal Section). Histograms for each laser power were created by averaging over particle trajectories extracted from 9 videos, each with a length of 23 min. (c) Linear dependence of the average well depth U as a function of the applied laser power P. U was calculated by averaging |u(x)| for the data in (b) for the central part of the channel for -0.75 μm< x <0.75 μm. The solid line is a linear fit to the data forcing the intercept to 0.
