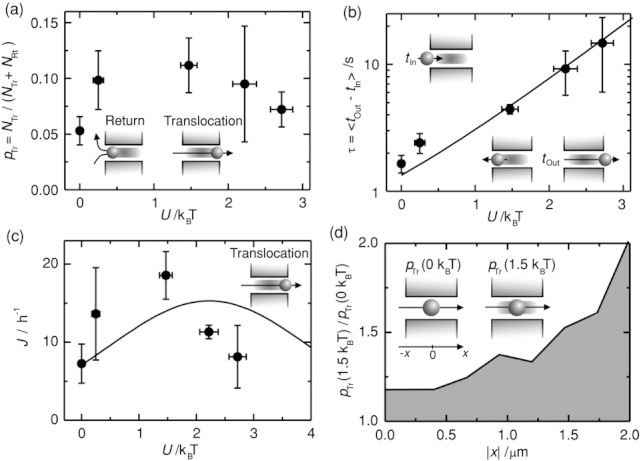
Figure 4.

Optimal trapping potential-facilitated transport: (a) Dependence of the average translocation probability pTr = NTr/(NTr + NRt) on the average potential depth U. NTr denotes the number of particles translocating from one reservoir to the other, while NRt is the number of particles returning to the same reservoir (see insets). (b) The average lifetime τ increases as a function of U. τ is the difference between the time the particle enters tIn and leaves the channel tOut to either reservoir (see insets). Solid lines are predicted values calculated according to Equation (1) with the experimental parameters determined from our measurements. (c) The flux of particles translocating (see sketch) the channel per hour J as a function of U shows a clear maximum. J is increased by a factor of three at optimum U = ∼1.5 kBT. The solid line is a prediction calculated using Equation (2) and the experimental parameters (see Experimental Section). (d) Dependence of the ratio between the probability to translocate a channel for the optimal potential pTr(U = 1.5 kBT) and the one to translocate a channel in free-diffusion pTr(U = 0) as a function of the particle position in the channel |x|. This illustrates that the line trap increases the translocation probability for particles at the opposite entrance. Error bars are calculated as the standard deviation of the corresponding measured values in three independent experiments for the vertical axes and as in Figure 3c for the horizontal axes.
