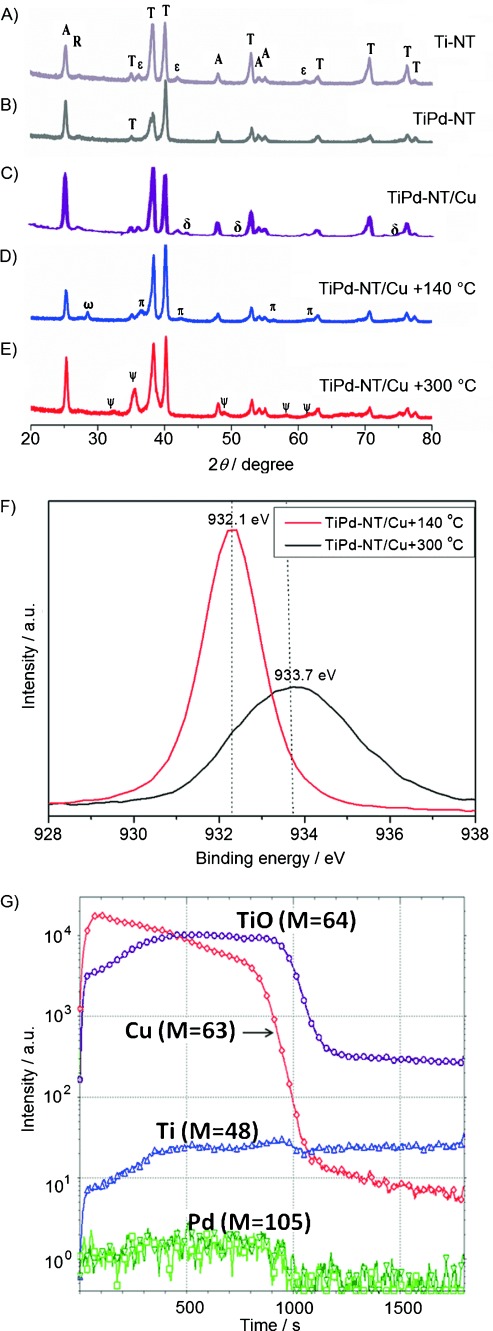
Figure 2.

XRD patterns for the annealed TiO2 nanotube layers. A) Ti-NT; B) TiPd-NT; C) TiPd-NT/Cu; D) TiPd-NT/Cu, thermally treated at 140 °C; E) TiPd-NT/Cu, thermally treated at 300 °C; T=titanium, A=anatase, R=rutile, ε=TiO, δ=Cu, π=Cu2O, ψ=CuO, ω=copper sulfide (contamination). F) XPS spectrum of the sample with Cu deposition on Ar-annealed TiO2 nanotubes, thermally treated at 140 and 300 °C; G) TOF-SIMS analysis of TiPd-NT/Cu, thermally treated at 140 °C.
