
Figure 8.
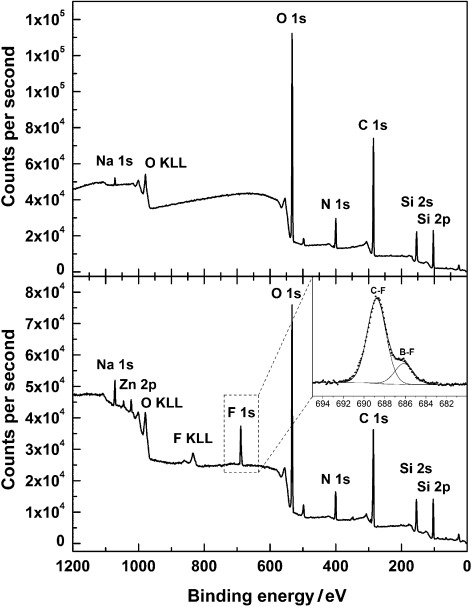
XPS survey scan spectra of the dye-covered area of the slides shown in Figure 7, amino-functionalized slide prior to (slide B, top) and after reaction with 5 (slide D, bottom; inset shows high-resolution F 1s core level spectra) as described in the text.