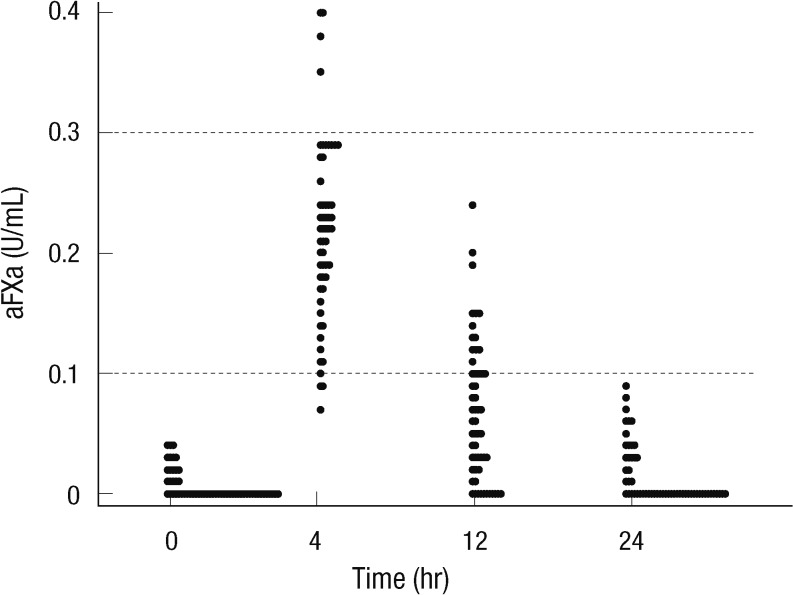
Fig. 1.
Antifactor Xa levels at 0, 4, 12, and 24 hr after administration of 40 mg of enoxaparin. The horizontal axis represents the time (hr), while the vertical axis represents the aFXa levels (U/mL). The circles (•) represent aFXa levels of patients at 0, 4, 12, and 24 hr after administration of 40 mg of enoxaparin.

