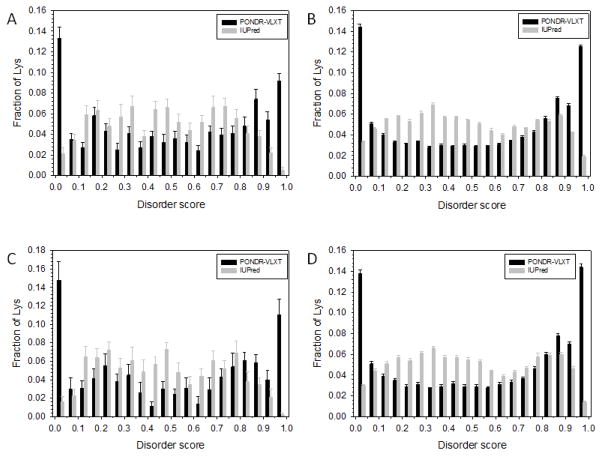
Figure 2. Comparison of the disorder status of acetylated and non-acetylated lysines in the extracellular and intracellular tachyzoites.
Here, the distributions of lysines over the various ranges of disorder score are shown. Comparison of the outputs of the PONDR® VLXT (black bars) and IUPred (gray bars) for the acetylated (A) and non-acetylated (B) lysines in the extracellular tachyzoites, and for the acetylated (C) and non-acetylated (D) lysines in the intracellular tachyzoites. Here, the distributions of lysines over the various ranges of disorder score are shown for different datasets. Error bars corresponds to the errors evaluated by bootstrapping.

