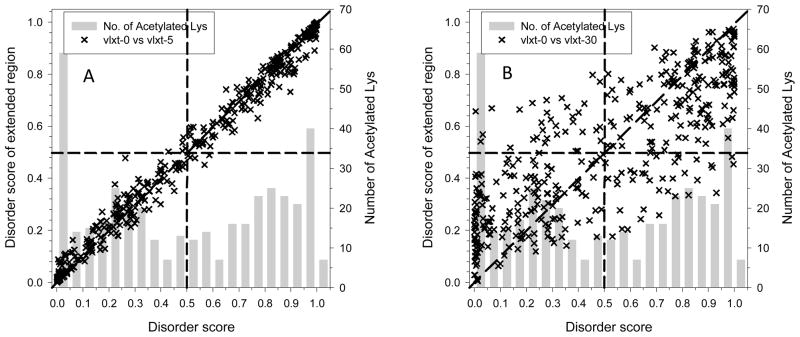
Figure 4. Disorder scores of acetylated lysines and analysis of their local environment.
The disorder score of each acetylated lysine in the 274 proteins from intracellular tachyzoites was predicted using PONDR® VLXT. The influence of neighboring residues was measured by averaging disorder scores over peptides centered at the target lysine but extended on both sides by a specific number of residues. The length of the extension is 5 (A) or 30 residues (B) and the corresponding scores are labeled as vlxt-5 and vlxt-30; vlxt-0 represents the original prediction score without an extension. Each “x” in the figure is an acetylated lysine. The x-axis displays the original disorder scores for the acetylated lysines and the y-axis displays the average disorder score over the extended regions. The gray bars represent the distribution of the original PONDR® VLXT scores for the acetylated lysines. Similar plots generated for vlxt-10, vlxt-15, vlxt-20, and vlxt-25 are shown in Supplementary Figure S2.

