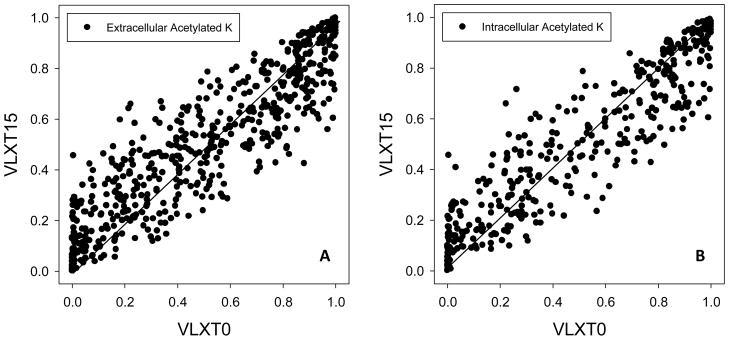
Figure 8. Comparison of the local environments of acetylated sites in extracellular (A) and intracellular tachyzoites (B).

Similar to the data shown in Figure 4, the influence of neighboring residues was measured by averaging disorder scores over peptides centered at the target lysine but extended on both sides by a specific number of residues. The length of the extension is 15 and the corresponding score is labeled as vlxt-15; vlxt-0 represents the original prediction score without an extension. Each symbol in the figure is an acetylated lysine. The x-axis displays the original disorder scores for the acetylated lysines and the y-axis displays the average disorder score over the extended regions.
