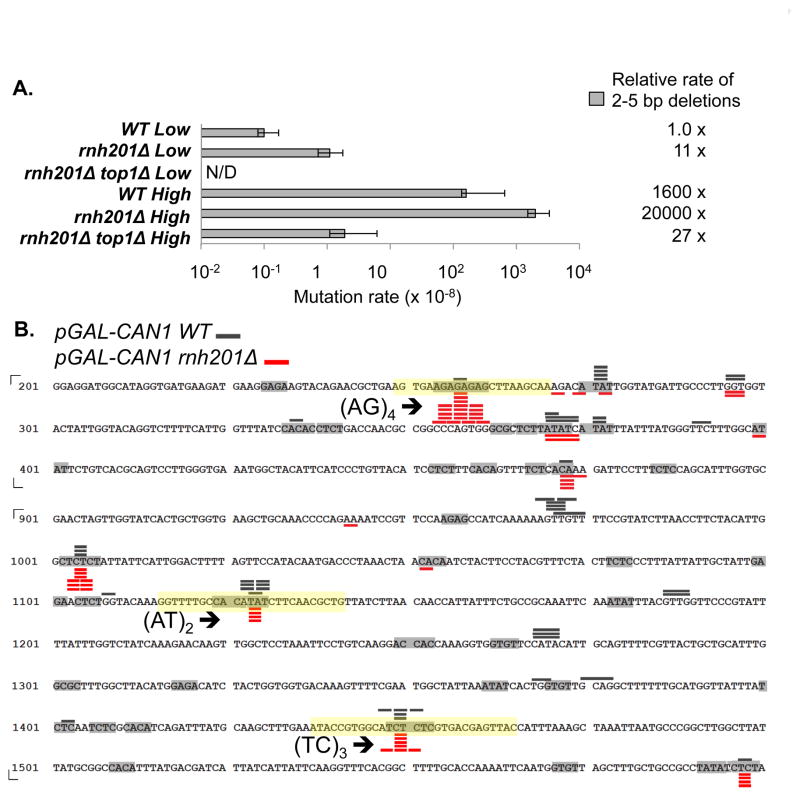
Fig. 2. 2–5 bp deletions at CAN1.
A. Rate of 2–5 bp deletions. The rate under low-transcription in an rnh201Δ top1Δ background is not shown because it was determined in a different strain background [14]. Error bars show 95% confidence intervals. B. Locations of 2–5 bp deletions. Only a part of CAN1 ORF is shown. Grey bars over the sequence and red bars below the sequence represent deletion events observed in the WT and rnh201Δ background, respectively (Table S2). The length of the bars corresponds to the size of deletion. Light grey boxes highlight all dinucleotide repeats. The (AT)2, (TC)3, and (AG)4 hotspot-containing sequences transplanted into the lys2ΔA746,NR reversion window are highlighted with yellow boxes.

