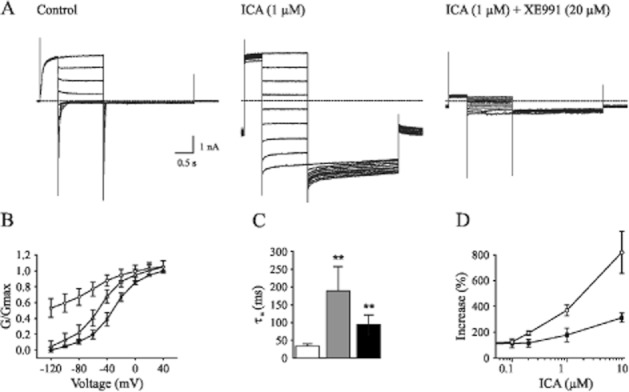
Figure 2.

ICA-110381 slowed deactivation and shifted activation curve in KCNQ2-mediated currents. (A) Example whole-cell currents recorded from individual CHO cells expressing KCNQ2, under control conditions, after bath application of 1 μM ICA-11038 and after bath application of XE 991 (20 μM). Currents were activated from a holding potential of −70 mV by depolarizing pulses to +40 mV for 500 ms and deactivated by 1 s hyperpolarizing pulses to potentials between −120 and +40 mV, followed by a step to −120 mV. (B) Conductance–voltage activation curves under control conditions, after application of 1 μM ICA-110381 (ICA) and 1 μM retigabine (RTG). Data were obtained from the tail currents at −120 mV elicited by the protocol described in panel A. Conductance were normalized to the maximal conductance under control conditions after leak subtraction. (C) Deactivation times obtained from biexponential fits of tail currents at −120 mV after a hyperpolarizing pulse of −40 mV under control conditions in the presence of 1 μM ICA and in the presence of 1 μM RTG. (D) Concentration-dependent increase of tail current at −120 mV after a hyperpolarizing pulse of −40 mV and weighted deactivation time obtained by fitting the same trace.
