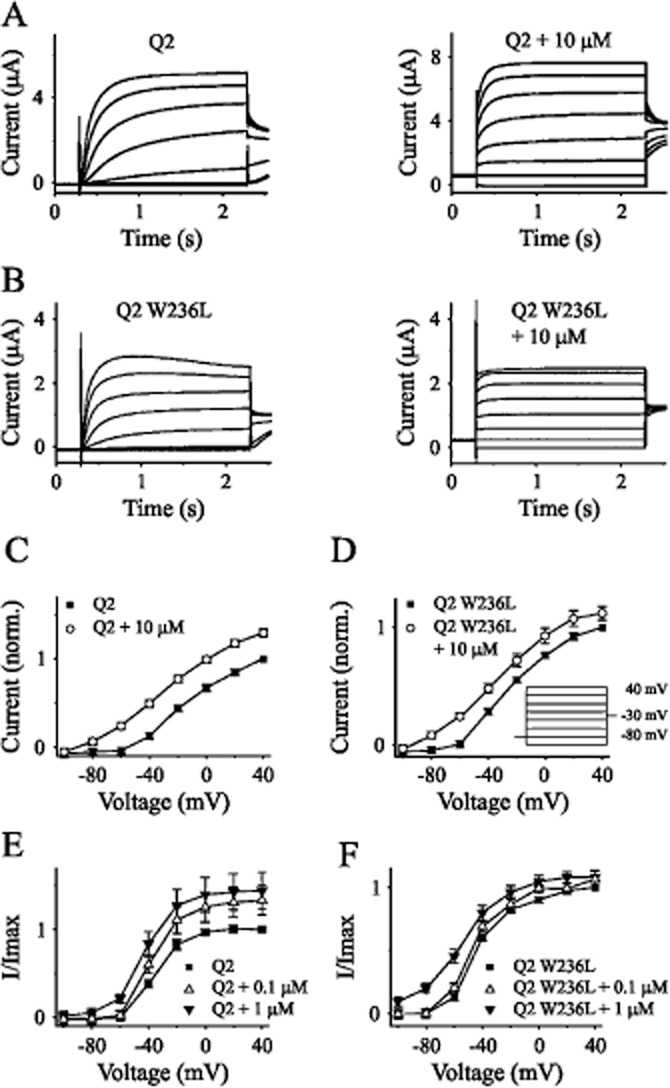
Figure 5.

ICA-110381 activates KCNQ2-W236L. Typical current traces of oocytes expressing KCNQ2 (A) and KCNQ2-W236L (B) before and after the application of 10 μM ICA-110381 (ICA). The voltage protocol used for experiments is shown in panel D. From a holding potential of −80 mV, oocytes were clamped to values between −100 and +40 mV, followed by a constant tail pulse of −30 mV. Current–voltage (I/V) curves of KCNQ2 (n = 8) (C) and KCNQ2-W236L (n = 9) (D). Voltage dependence of I/Imax curves of KCNQ2 (n = 10) (E) and the mutant KCNQ2-W236L (n = 10) (F) measured in absence or presence of 0.1 and 1 μM ICA respectively.
