Figure 8.

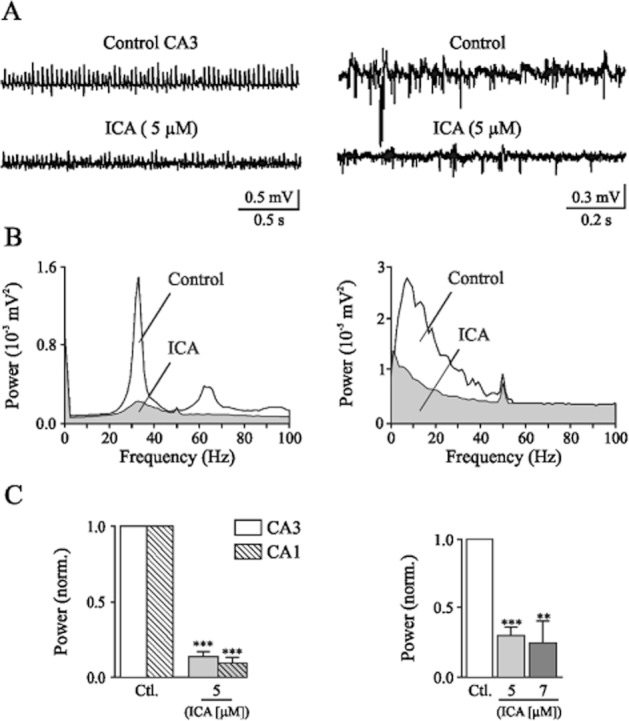
Kainate-induced network oscillations in rat hippocampal slices are reduced by ICA-110381. (A) Sample recordings in horizontal slices from stratum pyramidale in area CA3 (left) showing kainate-induced γ frequency oscillations under control conditions (top trace), following a 60 min bath application of 5 μM ICA-110381 (bottom trace) and in coronal slices from stratum pyramidale in area CA3 (right) showing kainate-induced θ frequency oscillations (top trace), following application of 5 μM ICA-110381 (bottom trace). (B) Corresponding power spectra for the recordings shown in panel A. Power spectra for γ oscillations (left) and θ oscillations (right) under control conditions, after 60 min of 5 μM ICA-110381 application. (C) Bar plots summarizing the results for γ oscillations in area CA3 and area CA1 for the effect of ICA-110381 and the results for theta oscillations for the effect of ICA-110381 on averaged normalized peak power. Asterisks denote significance levels of P < 0.01 (**) and P < 0.001 (***).
