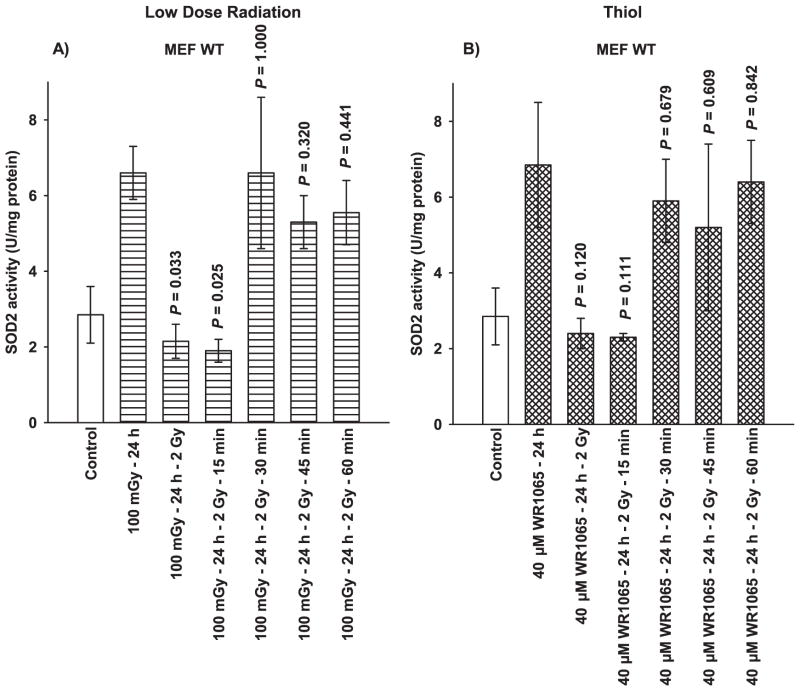
FIG. 5.
Effects of a 2 Gy radiation exposure as a function of time on SOD2 activity levels induced by a 100 mGy or 40 uM WR1065 exposure 24 h earlier. Activity levels are contrasted to unirradiated control cells. Times in minutes represent times post 2 Gy irradiation. Each experiment was repeated at least twice and error bars represent the SEM.

