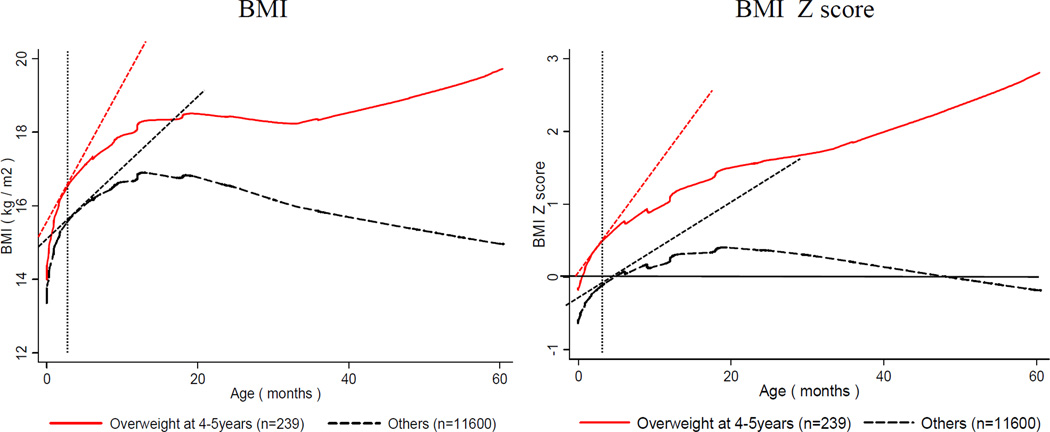
Figure 1. Comparison of BMI and BMI Z score from birth to 5 years old between children being overweight vs. non-overweight at 4–5 years in China*†‡.
*BMI for age Z score was calculated based on the 2006 WHO Growth Standard.
†Overweight (n = 239): BMI Z score ≥ 2 SD at 4–5 years; others (n = 11,600): non- overweight.
‡The BMI and BMI Z score growth curves by overweight at 4–5 years were presented using locally weighted scatter plot smoothing curve.
The 4 tangent lines on each figure showed how the growth rates in figure 2 were drawn from these growth curves.

