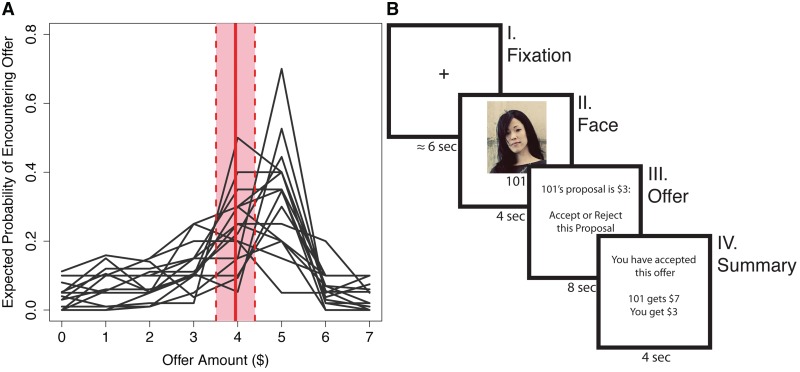
Fig. 1.
Ultimatum game. (A) Participant's expectations about the Ultimatum game. Solid red line reflects average weighted mean. Dotted lines reflect ±1 s.d. (B) A trial timeline. (I) Fixation cross. (II) Picture of their partner for the round. (III) Offer revealed and participant decision (accept or reject offer). (IV) Summary of earnings for the round.

