
Fig. 2.
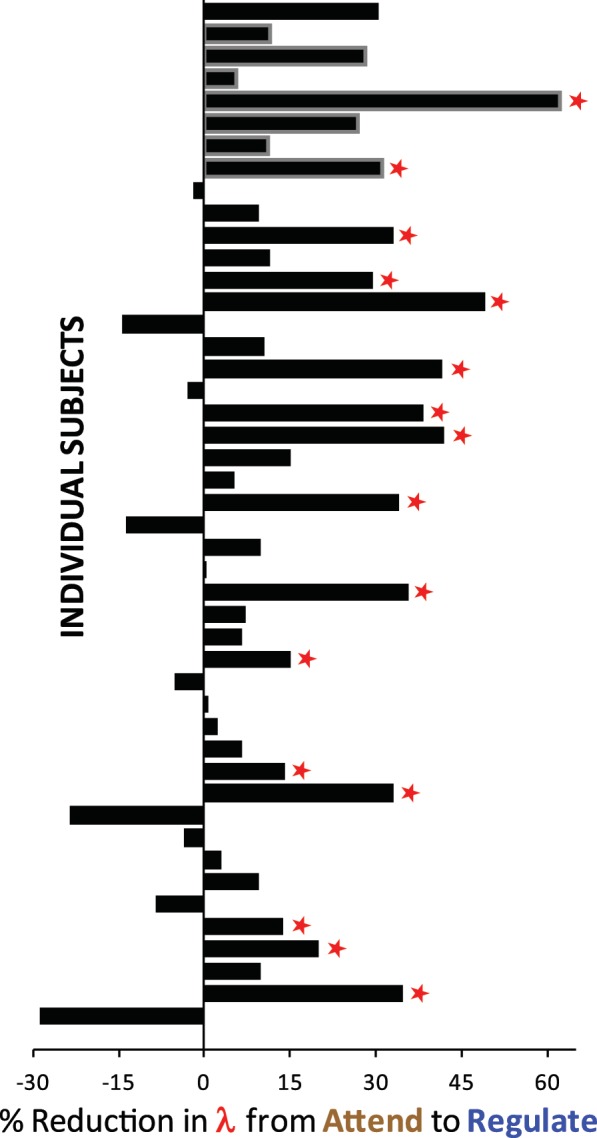
Regulation reduced loss aversion. Percent reduction in behavioral estimates of individuals’ loss aversion from ‘Attend’ to ‘Regulate’ (100 × (λATTEND − λREGULATE)/ λATTEND). A positive number indicates less loss aversion in the ‘Regulate’ condition. Bars outlined in gray were subjects excluded from the analysis of outcomes (see Experimental Procedures: Participants). Red stars indicate individuals whose shift in loss aversion was individually significant at the P < 0.05 level. Participants are descendingly ordered by loss aversion, with the most loss averse at the top, and the least loss averse at the bottom.