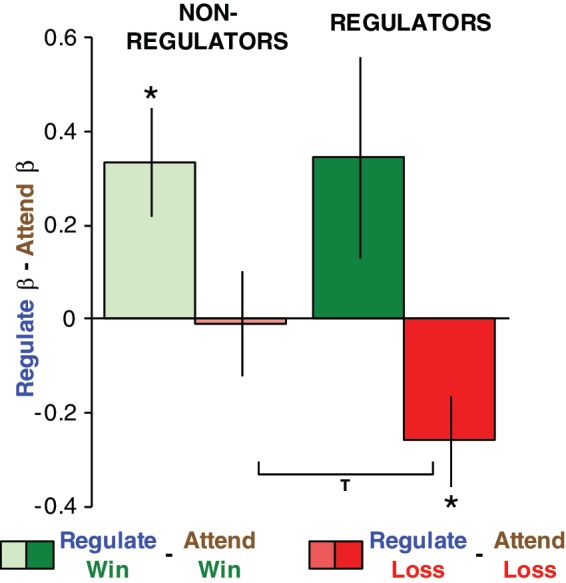
Fig. 4.

Successful regulators reduce amygdala responses to loss outcomes. β estimates are extracted from the left amygdala region identified in Figure 3 and Table 1. Y-axis is the β estimate in ‘Regulate’ minus that in ‘Attend’ for either wins (greens) or losses (reds). Positive numbers indicate increased activity in ‘Regulate’, negative numbers indicate reduced activity in ‘Regulate’. Asterisks indicate significantly different from zero at P < 0.05. “T” indicates a significant group difference (one-tailed two-sample unequal variance t-test, P = 0.05).
