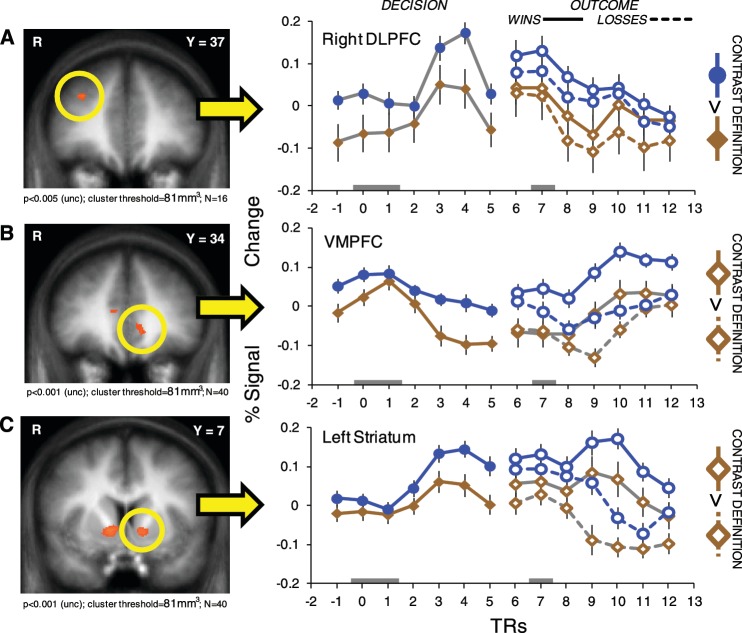
Fig. 5.
Trial-triggered averages for activity in (A) right DLPFC, (B) VMPFC and (C) left striatum. Brown diamonds represent ‘Attend’ activity, and blue circles represent ‘Regulate’ activity. Decision activity is indicated with filled-in markers, outcome activity with outlined markers, and wins and losses with solid and dotted lines, respectively. The contrasts used to define the ROIs are indicated on the right, and their respective lines are plotted in gray on the graph. Decision activity is locked to the time of decision presentation (TRs 0 and 1, indicated by gray block on X-axis). Outcome activity is locked to the presentation of the outcome (labeled TR 7 on the graph, indicated by gray block on X-axis). Error bars are standard error of the mean

