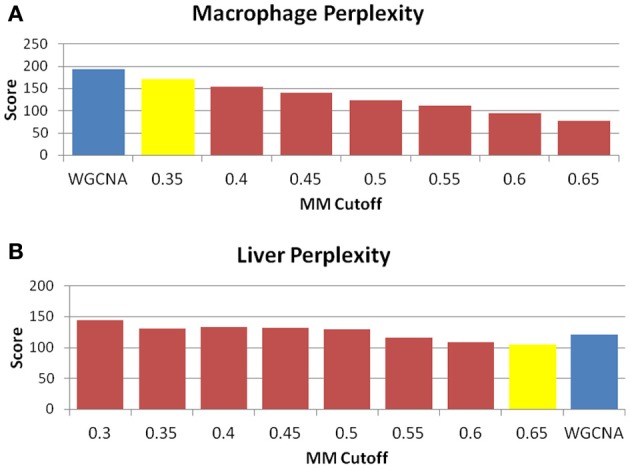
Figure 6.

MICA returns a small improvement in module entropy over WGCNA. Perplexity measures for (A) macrophage and (B) liver. The blue bar is the score received by WGCNA, while the yellow bar is the score returned for MICA at the optimal MM cutoff. As perplexity is a measure of entropy, a lower score is more desirable. In both cases, a small improvement in perplexity is observed in the optimal MICA modules vs. the WGCNA modules.
