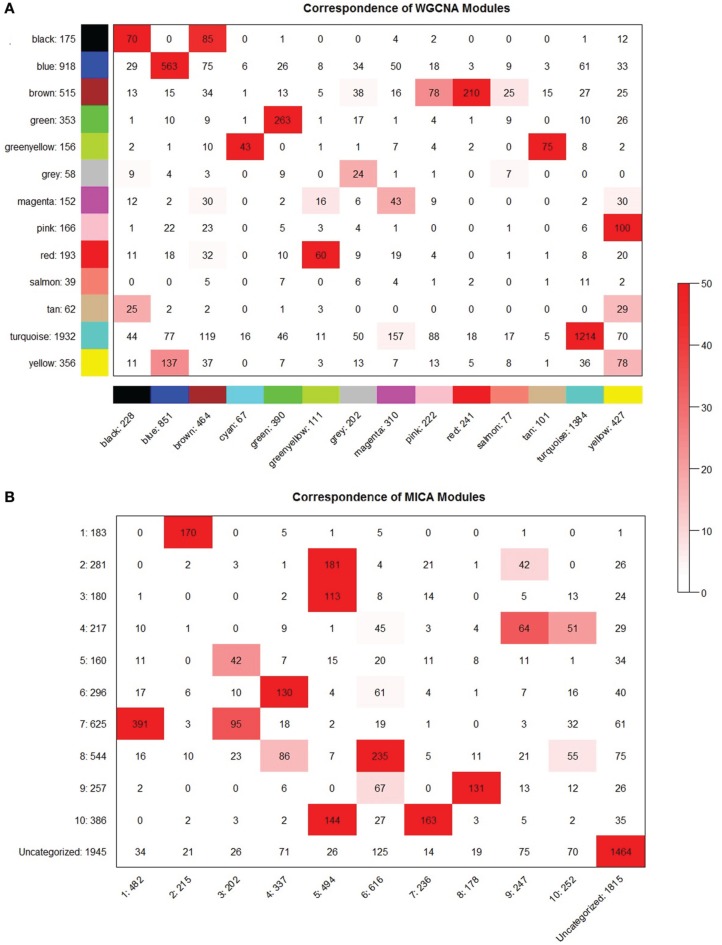
Figure 8.
MICA and WGCNA have comparable module preservation statistics. Module preservation between even partitionings of the macrophage dataset for (A) WGCNA and (B) MICA. Preservation significances are calculated using a Fisher's exact test and are represented by the depth of the red color as indicated.

