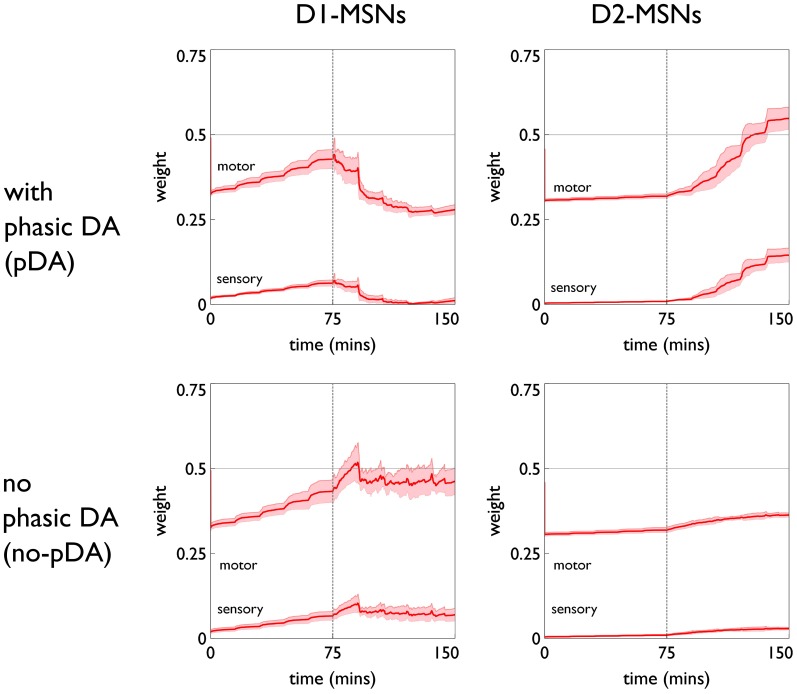
Figure 10.
Weight trajectories w*(t) for the active response channel, in models with novelty salience and prediction, undergoing variable interval training. Rows are for pDA and no-pDA models, columns for D1- and D2-type MSNs. Weights from motor cortex and sensory cortex are labeled “motor” and “sensory.” The trajectories are expressed as continuous functions of time to show both within-day, and between-day dynamics, and the onset of the response contingent phase (at the start of day 6) is indicated at 75 min. These plots capture the statistics of the weights over a group of 10 models; the dark red line is the mean, and the red-shaded region encompasses ± 1 std dev.

