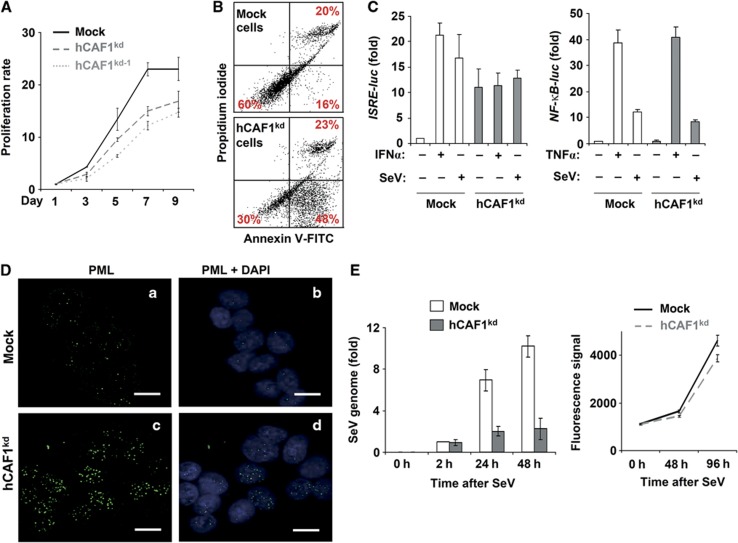
Figure 2.
Physiological outcome of hCAF1 knockdown cells. (A) Cell growth of mock and hCAF1kd cells was measured by the Uptiblue assay, and (B) apoptosis by using the Annexin-V-FITC assay. (C) Mock and hCAF1kd cells transfected with the reporter plasmids ISRE-Luc (left panel) or with NF-κB-Luc (right panel). ISRE- and NF-κB-dependent luciferase activities were measured after treatment with IFNα or infection with Sendai virus (SeV) (left panel) or with TNFα or SeV (right panel), respectively. Luciferase activities were normalized to the activity of the internal control Renilla luciferase and expressed as activation relative to the basal level in mock control cells (arbitrarily set to 1). (D) Confocal fluorescence microscopy experiments using anti-PML antibodies on untreated mock (a, b) and hCAF1kd cells (c, d). Scale bar=20 μm. (E) Mock and hCAF1kd cells were infected with SeV (left panel). The virus genome was quantified by RT–qPCR at the indicated times after the infection. Each set of experiments was performed in triplicate and repeated at least three times. Uptiblue Reagent was used to assess cell viability and cell proliferation of hCAFkd and mock cells after SeV infection (right panel). All the illustrated data were performed in triplicate and are expressed as mean values of three independent experiments. Standard deviations are shown.

