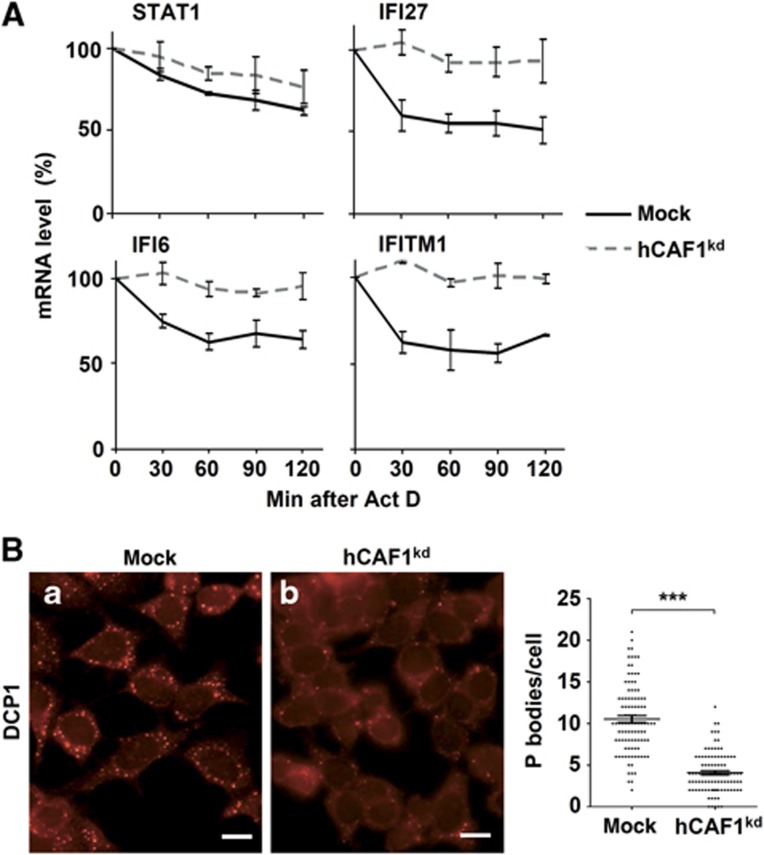
Figure 3.
Determination of the stability of hCAF1-regulated genes. (A) Mock and hCAF1kd cells were treated with Actinomycin D and total mRNA was isolated at the indicated times after treatment. mRNA levels of the indicated genes were determined by SYBR green real-time RT–PCR as described in Figure 1. Results were plotted as a function of time from drug addiction. Results are expressed as mean values of at least three independent experiments. Standard deviations are shown. (B) Effect of hCAF1 knockdown on P-body formation, analysed using a rabbit antibody directed against Dcp1a. Fluorescence microscopy is representative of at least three independent experiments. Scale bar=20 μm. Quantification of the number of signals per cell (n=100) was performed (mean±s.e.m.) using Image J software. Student’s t-test. ***P<0.001.

