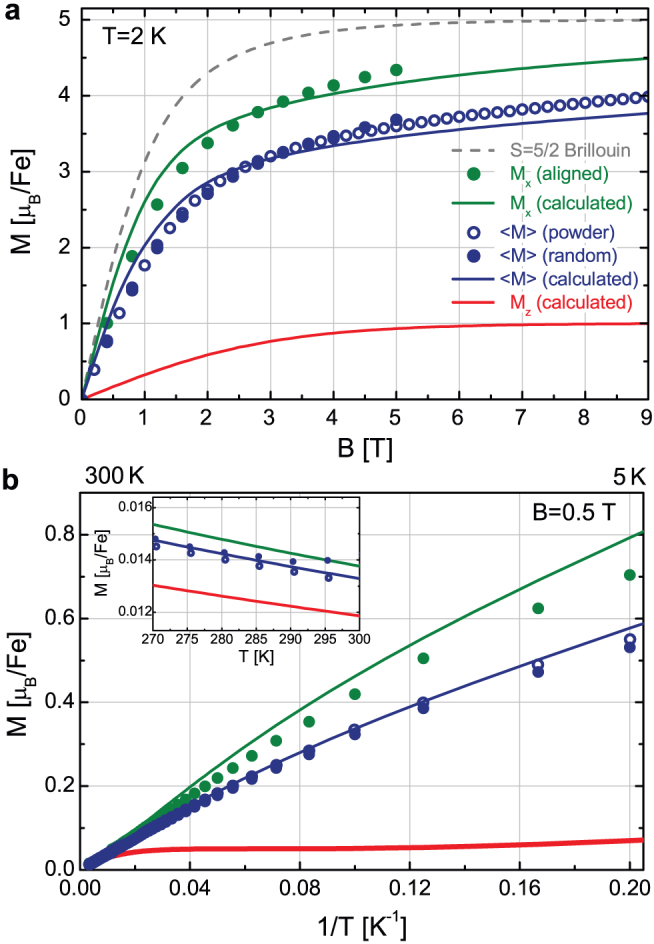
Figure 3. Magnetization anisotropy of malaria pigment crystals.

(a) Field dependence of the magnetization measured at T = 2 K for a powder sample, randomly oriented (zero-field cooled suspension) crystals and magnetically aligned (field cooled suspension) crystals are shown by blue open circles, blue dots and green dots, respectively. As expected, the former two are essentially identical. Magnetization curves calculated for fields lying within the easy plane and pointing along the hard axis of a crystal are also plotted with green and red lines, respectively. The angular average of the magnetization corresponding to the random orientation of the crystals is also displayed with blue line. (For details of the calculation see the Methods section.) Magnetization values are given for a single iron site in Bohr-magneton units. To emphasize the anisotropic character of hemozoin, Brillouin's function describing the magnetization of an isotropic S = 5/2 spin is also shown (dashed grey line). (b) Low-field magnetization of hemozoin as a function of the inverse temperature measured in B = 0.5 T. The position of 300 K and 5 K are indicated on the upper scale. The inset shows the data on a linear temperature scale around 300 K. Symbols and lines indicate respectively the same measured and calculated quantities as in panel (a).
