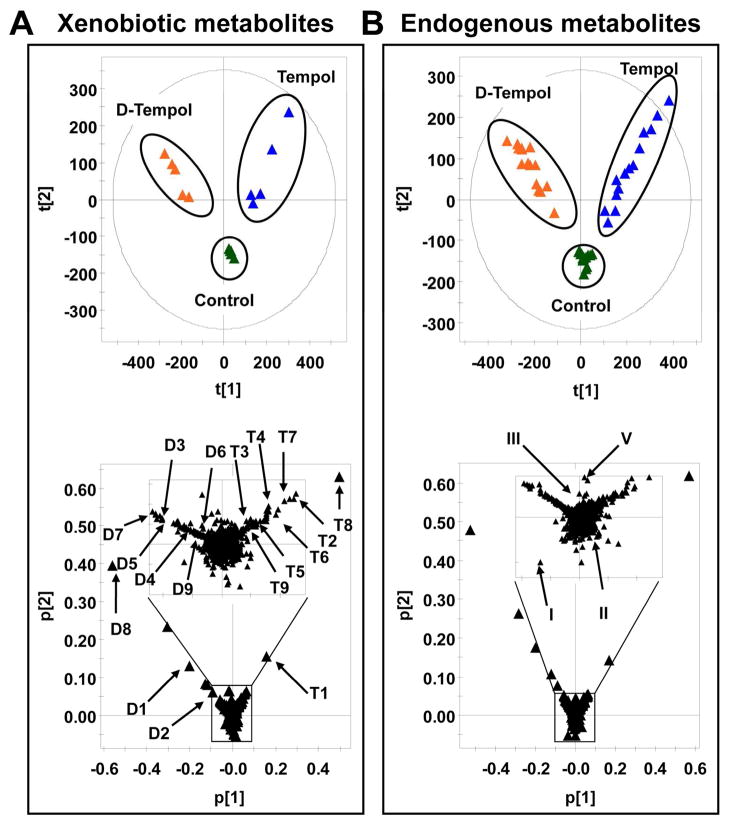
Figure 2. Metabolomic analysis of xenobiotic and endogenous metabolites in mouse urine.
(A) Scores plot of a PCA model and PCA loadings scatter plot of urinary ions from tempol treatment (50 mg/kg), D-tempol treatment (50 mg/kg), and control group at day 1. Each point represents an individual mouse urine sample (top) and a urinary ion (bottom). Tempol and D-tempol metabolites are labeled in the loadings scatter plot (T1 to T10 and D1 to D10). (B) Scores plot of a PCA model and PCA loadings scatter plot of urinary ions in tempol treatment (50 mg/kg), D-tempol treatment (50 mg/kg), and control group from day 1 to 5. Each point represents an individual mouse urine sample (top) and a urinary ion (bottom). The regulated-endogenous metabolites are labeled in the loadings scatter plot (I to IV). The t[1] and t[2] correspond to principal components 1 and 2, respectively. The p[2] values represent the interclass difference and p[1] values represent the relative abundance of the ions. All the data were obtained in positive mode (ESI+).

