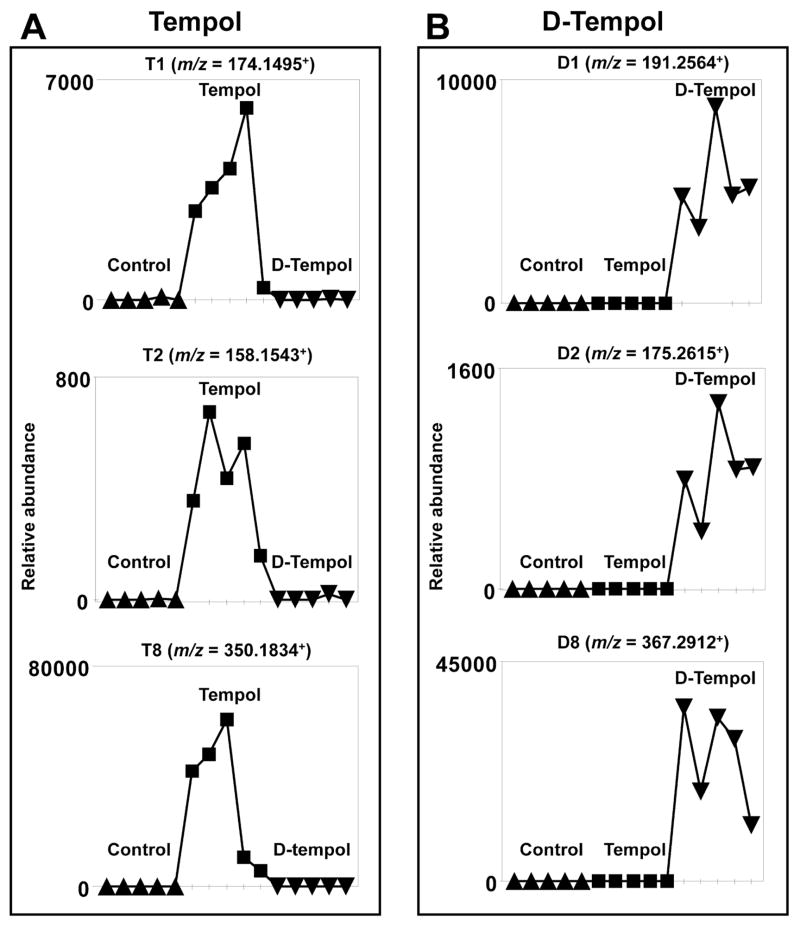
Figure 3. Trend plots of ions in control, tempol and D-tempol groups.
(A) Tempol metabolites with m/z values of 174.1495+ (T1), 158.1543+ (T2), and 350.1834+ (T8). (B) D-tempol metabolites with m/z values of 194.2564+ (D1), 175.2615+ (D2), and 367.2912+ (D8). Note the presence of suspected tempol and D-tempol metabolites in the tempol treatment and D-tempol group (n = 5), respectively. Metabolite codes correspond to those in Table 1.

