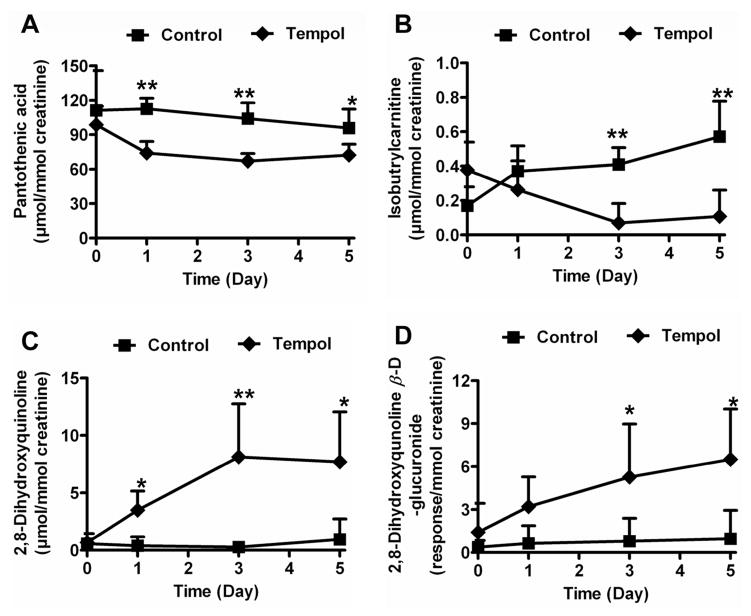
Figure 4. Quantitation of urinary pantothenic acid, isobutyrylcarntine, 2,8-dihydroxyquinoline and 2,8-dihydroxyquinoline-β-D-glucuronide.
Results were normalized to creatinine concentration. (A) Pantothenic acid in high dose tempol (250 mg/kg) and control mice from day 0 to 5. (B) Isobutyrylcarnitine in low dose tempol treatment (50 mg/kg) and control mice from day 0 to 5. (C) 2,8-Dihydroxyquinoline in low dose tempol treatment and control mice from day 0 to 5. (D) 2,8-Dihydroxyquinoline-β-D-glucuronide in low dose tempol treatment and control mice from day 0 to 5. P-values were calculated using an unpaired t-test. *P < 0.05, **P < 0.01.

