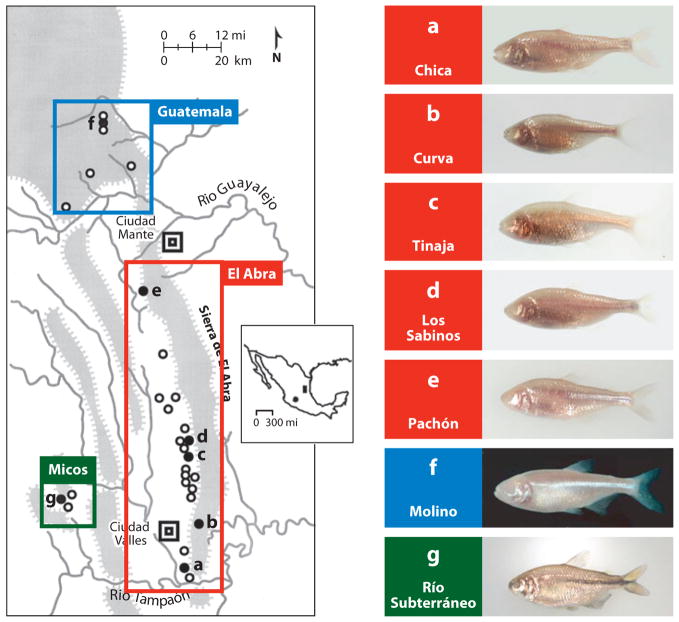
Figure 3.
Left: A sketch map showing the region containing 29 different Astyanax cavefish populations in northeastern Mexico. The spheres indicate the approximate position of caves with Astyanax cavefish. The shaded spheres (a–g) indicate specific cavefish populations shown on the right. The Guatemala, El Abra, and Micos clusters are indicated on the map. Inset: Mexico showing the northeastern region indicated in the sketch map (shaded rectangle) and the outlying Guerrero population (shaded sphere). Right: Examples of different cavefish shown in a–g on the left. Modified from Jeffery et al. (2003).

