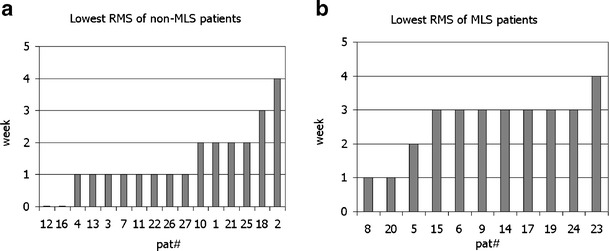
Fig. 3.

Lowest RMS values calculated in the 5 weeks of treatment. On the left, the lowest RMS of the non-MLS patients (a), and on the right, the lowest RMS of the MLS patients (b). The optimal CBCT scan as reference scan varied between the CBCT scan of the first week and the CBCT scan acquired in the fourth week. On average, the lowest RMS for the non-MLS patients was calculated in week 1 and for MLS patients in week 3
