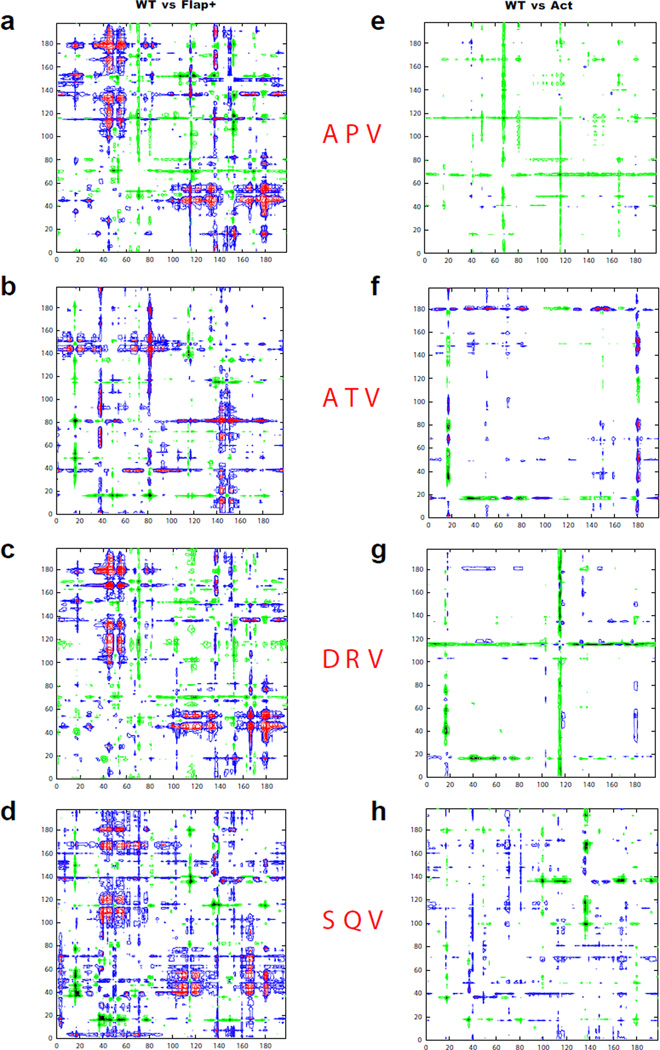
Figure 5.
Comparison of mutant complex structures with WT HIV-1 protease. Double difference plots (see Methods) illustrating the WT vs Flap+ structural changes in (a) APV, (b) ATV, (c) DRV and (d) SQV, and WT vs Act structural changes in (e) APV, (f) ATV, (g) DRV, (h) SQV. The key for contours: (i) black −5.0 to −1.0 Å and green −1.0 to −0.5Å (Corresponding residue distances in the mutant structures have increased); (ii) blue 0.5 to 1.0 Å and magenta 1.0 to 5.0 Å (Corresponding distances in the mutant structures have decreased).

