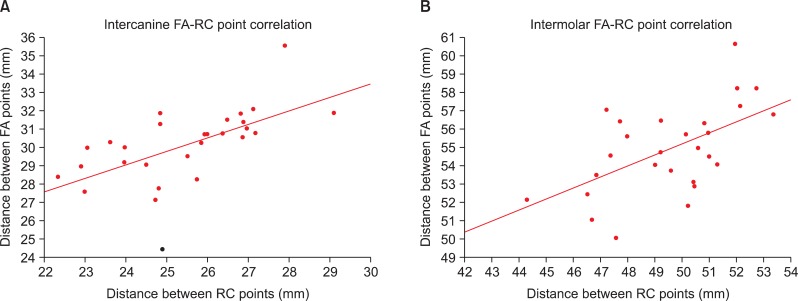
Figure 4.
A, Scatter plot showing correlation between the dental and basal mandibular intercanine widths in the Class III malocclusion group (r = 0.60, p < 0.001). B, Scatter plot showing correlation between the dental and basal mandibular intermolar widths in the Class III malocclusion group (r = 0.62, p < 0.001). FA, Facial axis; RC, root center.

