
Table 2.
Dental and basal intercanine and intermolar dimensions for normal occlusion and Class III groups
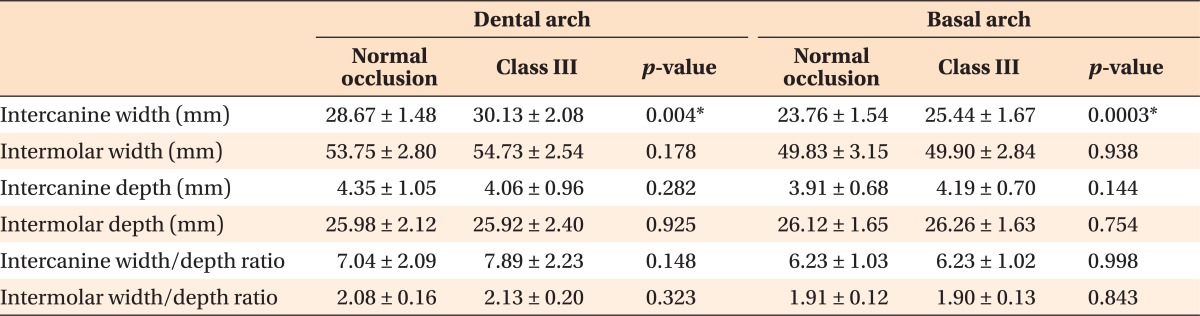
Values are presented as mean ± standard deviation.
Independent sample t-test; *p < 0.05.
NS, not significant.
Official websites use .gov
A
.gov website belongs to an official
government organization in the United States.
Secure .gov websites use HTTPS
A lock (
) or https:// means you've safely
connected to the .gov website. Share sensitive
information only on official, secure websites.
Dental and basal intercanine and intermolar dimensions for normal occlusion and Class III groups
Values are presented as mean ± standard deviation.
Independent sample t-test; *p < 0.05.
NS, not significant.