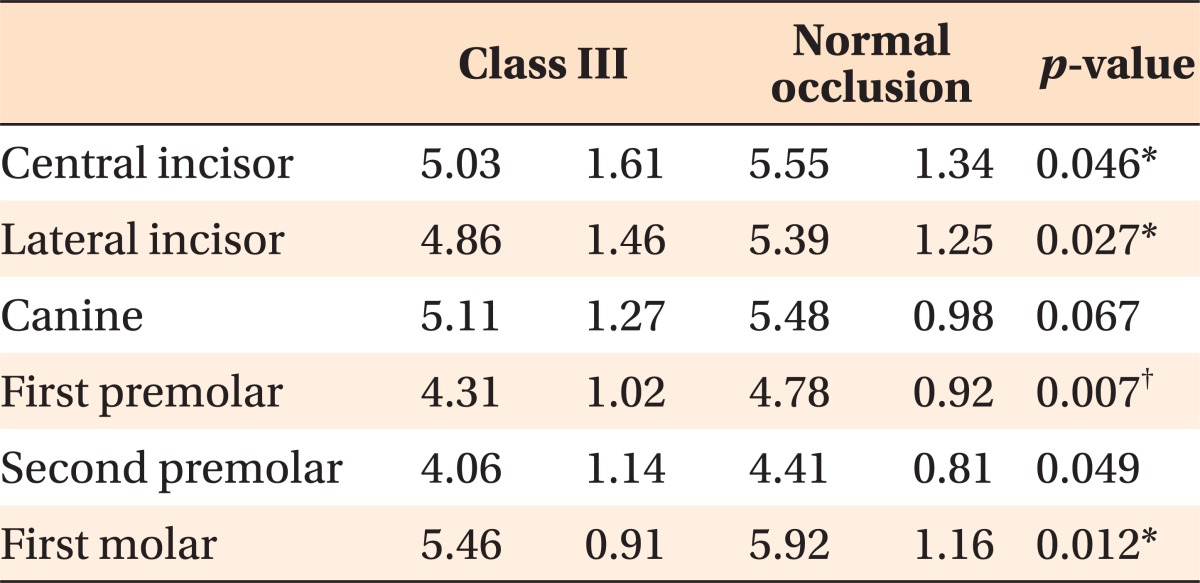
Table 3.
Horizontal distances between FA and RC points at each tooth for Class III malocclusion and normal occlusion groups (mm)

Values are presented as mean ± standard deviation.
Independent sample t-test; *p < 0.05, †p < 0.01.
Horizontal distances between FA and RC points at each tooth for Class III malocclusion and normal occlusion groups (mm)

Values are presented as mean ± standard deviation.
Independent sample t-test; *p < 0.05, †p < 0.01.