
Table 3.
Comparison of the DMFT, DT, MT, and FT scores according to the sample characteristics
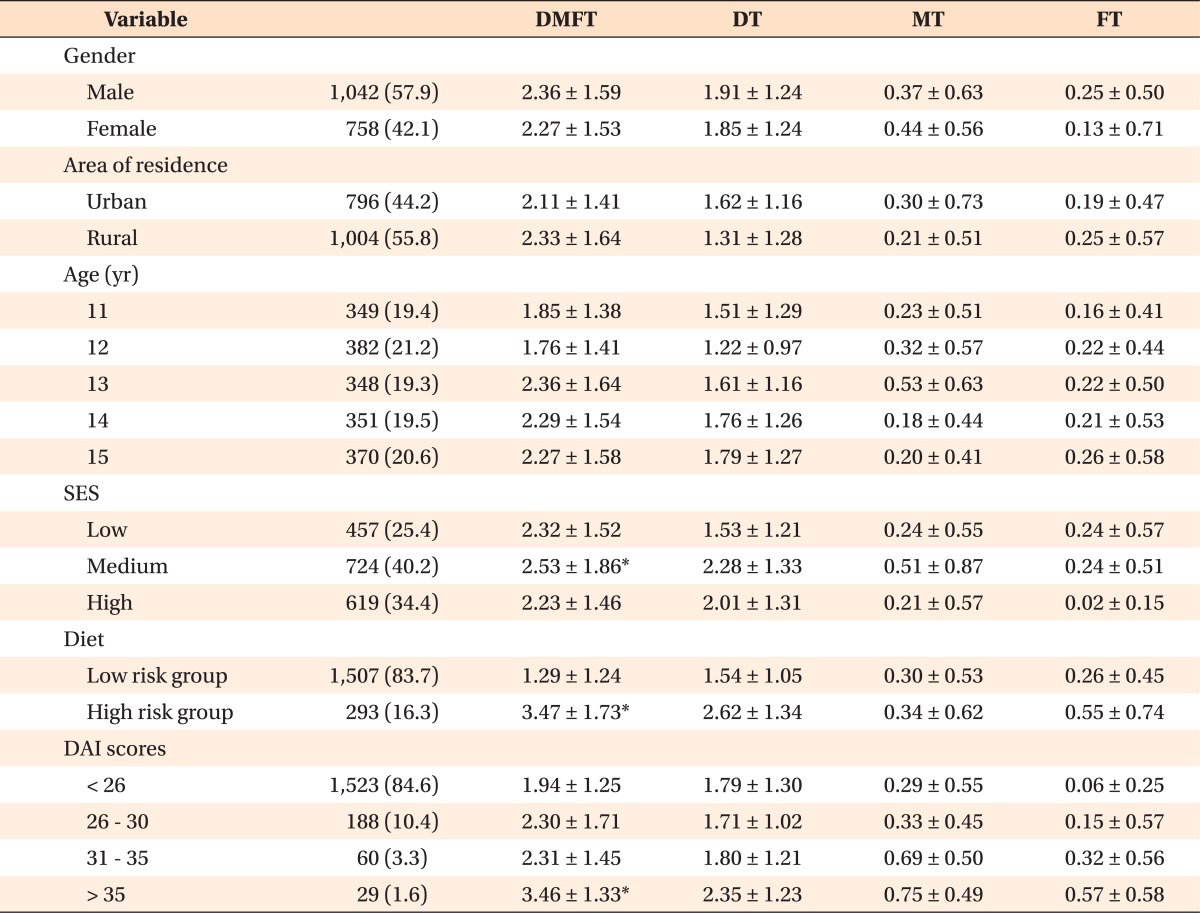
Values are presented as number (%) or mean ± standard deviation.
DMFT, Decayed, missing, and filled teeth; DT, decayed teeth; MT, missing teeth; FT, filled teeth; SES, socioeconomic status; DAI, Dental Aesthetic Index.
*Multiple comparisons with the Bonferroni adjustment at a significance level of α ≤ 0.05.